Greetings, fellow traders, An interesting setup is forming on the BINANCE:POLYXUSDT chart. The price is currently situated near the lower boundary of an established ascending channel, suggesting a potential support zone. We are identifying a potential long entry under the following conditions: A confirmed close on the 1-hour (or 30-minute for more...
Hey traders! Sorry, no chart Analysis! My suggestion is to enter above the $0.1530 price range With targets: 1- $0.1650 2- $0.1790 3- $0.1900 There is a possibility of a price correction to the $0.1400 range Good luck
Hello fellow traders, I've spotted a promising long opportunity on JASMY/USDT that I wanted to share with you. Here's the setup: Breakout Confirmation: JASMY has successfully broken out of a descending channel, indicating a potential shift in momentum. Retracement and Readiness: Following the breakout, the price has retraced, suggesting it's now poised for an...
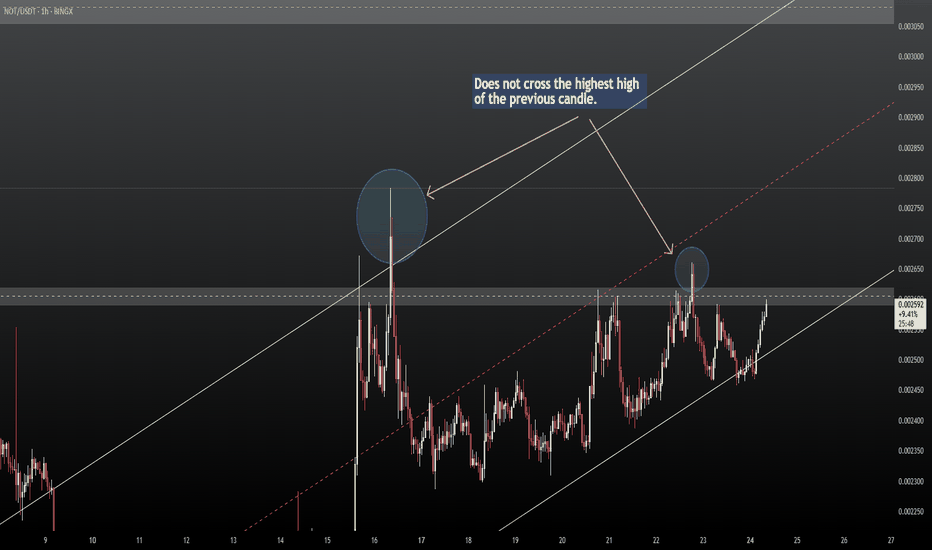
Greetings, fellow traders. While many cryptocurrencies are experiencing upward momentum or consolidating in preparation for potential rallies, Notcoin (NOT) has recently surged 4-5%, reaching a critical daily resistance zone. Breakout Potential: This resistance level has proven significant, with NOT having tested and failed to break through it twice this...
Fellow traders! MEUSDT is exhibiting classic ascending channel behavior. Having tested the lower channel boundary, the price is likely to advance towards the upper channel boundary, with a potential target near $1.300. Implement prudent risk management. BINANCE:MEUSDT
Greetings, fellow traders! Following a significant rally that reached the $0.1300 resistance zone, Wormhole (W) is currently undergoing a corrective phase. This retracement is finding support near the key 0.50 and 0.618 Fibonacci levels, a common area for price consolidation before a potential trend continuation. Anticipated Price Action: Based on the current...
Greetings, fellow traders! My analysis suggests a developing potential for a bullish move in POPCAT/USDT. I'm observing a possible breakout scenario, and I'll outline a potential long trade setup. Entry Rationale: A long entry is suggested above the $0.2135 level, contingent upon a confirmed breakout from the currently established neutral-bullish channel. This...
Hello, Traders! Grass/USDT is showing early signs of an uptrend, encountering initial resistance at $1.500. The asset is currently gathering momentum, with the potential to continue higher. A confirmed breakout above the resistance could lead to a test of the 59-period moving average on the 4-hour timeframe. I'm eyeing a potential long trade above $1.5250, with...
Hey traders! 4-hour timeframe: Price action consolidating within a descending triangle formation. A short trade opportunity presents itself as price approaches the upper resistance of the pattern, targeting the lower support range. Potential downside: approximately 14%. Happy trading
Greetings, traders, A more detailed analysis of the DYDXUSDT chart will follow in the comments section below. For now, a potential long opportunity presents itself above $0.7450. Entry: Above $0.7450 Take Profit: About $0.8350 Stop Loss: $0.7250 BINANCE:DYDXUSDT I will post a detail analysis of DYDXUSDT in comment. Profitable trades to all!
Hello traders! Following a significant price drop, CATIUSDT appears to be poised for a potential price increase or corrective rebound. This upward movement could offer an opportunity for traders who bought at higher prices or are currently holding the cryptocurrency. The anticipated price correction is likely to target the 0.382, 0.5, and 0.618 Fibonacci...
Hey traders! POPCAT/USDT is forming a head and shoulders pattern, signaling a likely continuation of the recent downtrend. Following a temporary price correction within the pattern, the downtrend is expected to resume. KUCOIN:POPCATUSDT Now is the time to short the PopCat, after the 2-hour candle closes, I enter a short trade below the closed 2-H...
📈 KUCOIN:ONDOUSDT Greetings, traders! On the 2-hour chart of ONDO/USDT, the fifth wave of an Elliott Wave uptrend appears to be forming, presenting a potential long trade opportunity. I've identified a potential entry point above $1.4400, with the following targets: Target 1: $1.6200 Target 2: $1.7000 My stop-loss would be placed in the range of...
Greetings, traders, The 🐶 DOGS/USDT chart reveals an interesting pattern after a two-month downtrend. We're now seeing short-term price corrections forming across multiple timeframes. These corrections are consistently reaching the 0.50 and 0.618 Fibonacci retracement levels, as well as the 50-period moving average on each respective timeframe. Based on this...
Simple Idea - Not Financial Advice! This is a highly speculative scenario, but one worth considering: a potential major Bitcoin crash bringing the price down to the $100,000 range and below. Observations: The current macroeconomic climate, could be contributing to a significant shift in market sentiment. A breakdown below key support levels at mention...
Greetings, fellow traders, This analysis presents a brief overview of GALAUSDT's current market position and potential for a long-term trade. While the recent two-day uptrend of GALAUSDT has been influenced by Bitcoin's price fluctuations, the overall outlook remains positive for a long-term, long position. Despite the current dip, Gala demonstrates significant...
Greetings, Traders, GALAUSDT has officially entered a downtrend, presenting a solid opportunity for short positions. I recommend entering a short trade below the $0.03150 price zone. Target 1: $0.03020 Target 2: $0.02910 A stop-loss order placed above $0.03250 could be considered to manage potential risk Following the breakdown below the key support...
Hi everyone, I'm looking at a potential long opportunity on BINANCE:OMUSDT , which appears to be repeating an Elliott Wave ABC pattern. As seen in mid-November 2024, the price completed a similar pattern: a strong initial rally (Wave A), a pullback to the 0.618 Fibonacci retracement (Wave B), and a final surge (Wave C) to the 2.00 and 3.00...


