Avangelina
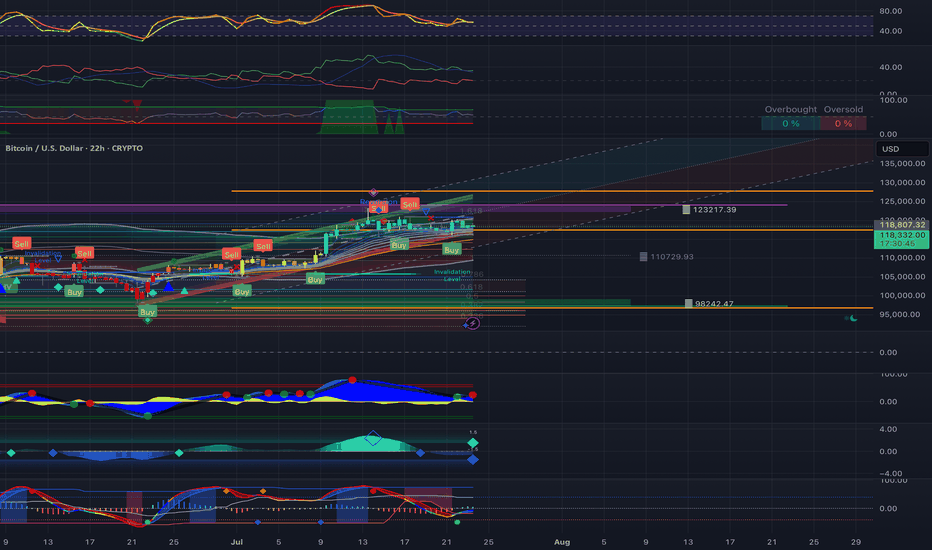
Premium🔹 Step 1: Base-Anchored Fibonacci Retracement Formula 🧮 Retracementₓ = Base + (Range × x) Inputs: • 🟢 Base = $74,458.42 • 🔴 High = $112,006.33 • 📏 Range = $112,006.33 − $74,458.42 = $37,547.91 📐 BTC Retracement Levels (Upward from Base) 1️⃣ Fib 0.236 = 74,458.42 + (37,547.91 × 0.236) = 74,458.42 + 8,862.92 = $83,321.34 2️⃣ Fib 0.382 = 74,458.42 + (37,547.91...
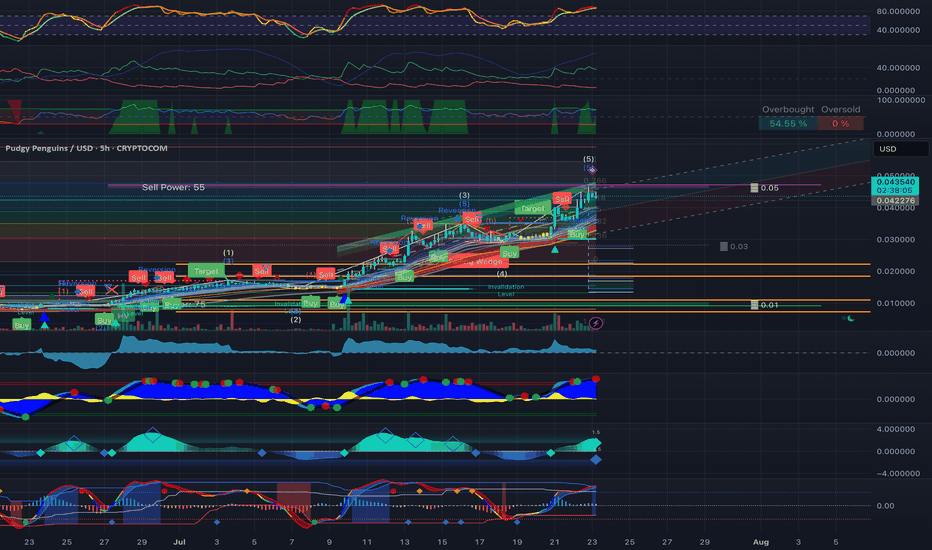
Using the new impulse base of $0.0079 and the confirmed 4.65× multiplier, the recalculated high is: - $0.0079 × 4.65 = $0.036735 All technical zones are now recalibrated off this updated anchor structure. PENGU Technical Breakdown – 4.65x Anchor at $0.0079 🔹 Price Anchors • Impulse Base (Confirmed): $0.0079 • Target High (Multiplier 4.65x): $0.036735 • Current...
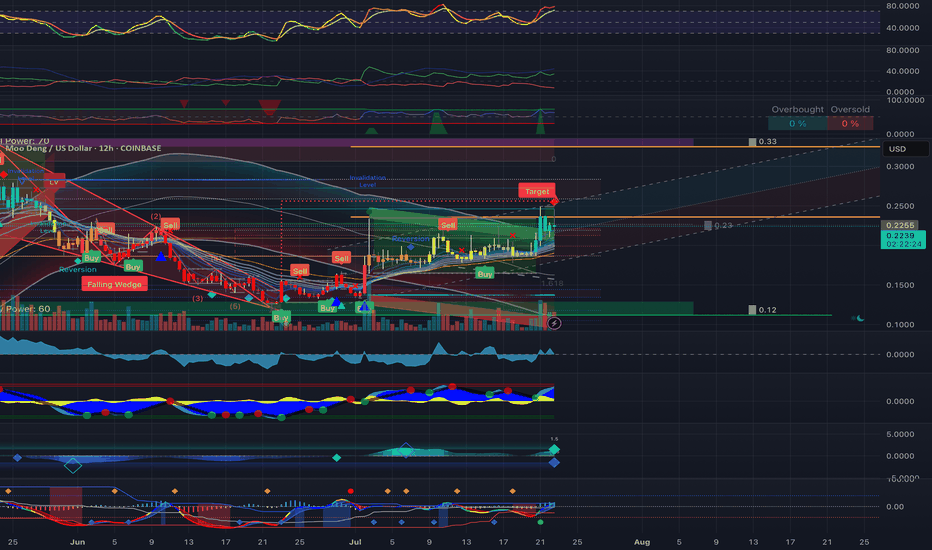
MooDeng Technical Breakdown – Finalized Impulse Model 🔹 Confirmed Price Anchors • Base (Start of Impulse): $0.12 • Cycle High (16×): $1.92 • Current Price: $0.2265 📐 Fibonacci Retracement ($1.92 → $0.12) • 0.236: $0.558 • 0.382: $0.796 • 0.500: $1.02 • 0.618: $1.244 • 0.786: $1.536 • 1.000: $1.92 🚀 Fibonacci Extensions (if $1.92 breaks) • 1.618:...
Okay, so SOL is breaking out of the bullish channel and my final prediction is $32 sometime in February. I believe that SOL is in an Elliot Wave correction and the previous (1) of the bullish run will be support. That price is $32. SOL has to breakout bearishly from the current channel to form a new bullish channel. My prediction is a $39 low for SOL, then a...
This post is an application of the Elliot Wave theory. BTC is going to crash at 59k and then down to who knows where at this point. I can at least predict a retest to the previous high which is a (b) correction before a final (c) correction.
Looks like a consolidation to the upside to me. Watch RSI and Stochastic for confirmation.
Clear as day Nasdaq 100 rules the global economy. We are seeing a significant sell-off after COVID-19 market innovation. Simple as that. There was too much medical innovation similar to the dot.com bubble where there was too much internet innovation. The regulators are stepping in because the markets have gone out of control and the housing market is affected by...
Watch out for BTC blowing past the major weekly trend-line. I think there will be problems if BTC goes below the green trend line which is around 23.4k. Not to be the scary bad news breaker, but we could see a LUNA crash repeat with Bitcoin or if not then a long drawn-out bear market for the next 1-2 years. We have to take trading the market 1 day at a time...
Bitcoin is being tested in the 1st recession and no one knows if crypto will survive. Bitcoin cannot close below $17280 and honestly the wick shouldn't touch below that level either. Make sure to set a stop loss at $17280.
If you are a scalper or a day trader who wants to capture the short-term fluctuations of each cryptocurrency pair using the 15-minute timeframe; You can use a 20-period simple moving average (SMA) to identify the overall trend direction You can use a 10-period exponential moving average (EMA) to identify the short-term trend direction You can use trend...
Enjoy a colorful chart featuring a smoother stochastic and a true range template. BTC3S listed on Kucoin is likely to hit the upper bands around .35cents. Nice quick short on BTTC3S. The SEC meeting did not go so well yesterday, so short Bitcoin in the meantime. Overall BTC is still bullish. Have some cake too!
This breakout is for real! No dead cat bounce here. The lines are fractal bottoms and tops with corresponsing fractal price action.
While not using a log chart, this idea could work in the short term. I do think a bull run has just begun, in the short-term. This Fib chart is only designed with the fib channel on the 1 month time frame. As you can see a fresh bull cross with the 12/50 EMA and the gaussian moving average has just begun. Bitcoin broke out of a falling wedge in November on the...
I believe the bottom is in for Bitcoin. The 1 week chart shows a breakout from a falling wedge pattern and literally no where else to go below a 0 fibonacci retrace pattern. I don't think Bitcoin can go lower based on these fib levels and a bottom at 0. I have no idea where Bitcoin is headed next but I am assuming within these fib levels on the chart.
Massive Bullish Cypher identified for Bitcoin. Time to long after falling wedge breakout. Time for new all time high. ATH
Bitcoin is showing a drop to the golden pocket (0.618) and support of the gaussian channel at the recent and current price action. This time I used the Heikin Ashi candles which are supposed to filer out some noise in the price action. If this data is correct then a bullish reversal should begin soon. Also, a retrace to 1.618 is not possible if this target is not...
The monthly candle for December, needs to close around $18,300 before the new year or else further downside. The green midline of the gaussian channel has been a bullish support for Bitcoin.
This is an updated chart with new fibs that populated today at 8pm eastern standard time. The new charts for the new year have been populated at this time. The 0.618 has been updated to around $5,412K.


