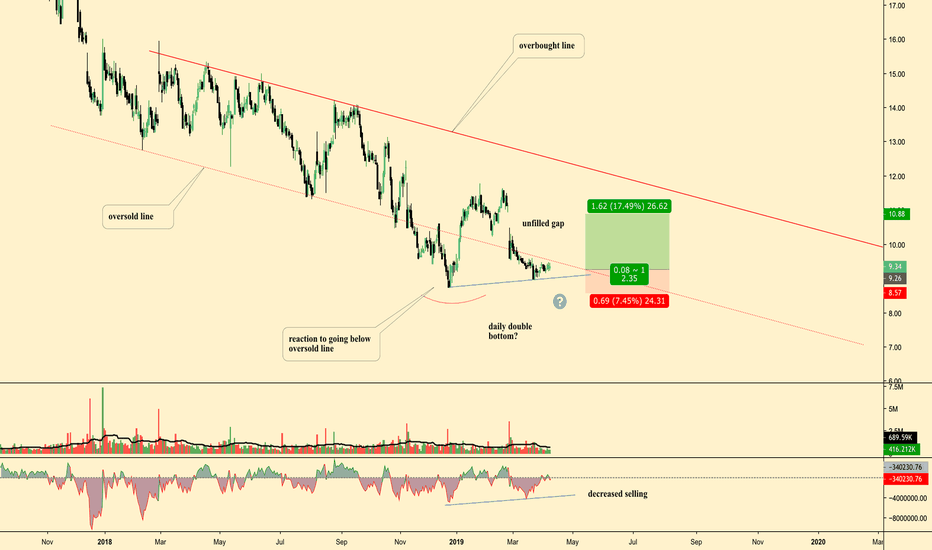
Short Idea based off previous weekly candle and current short-term trend. Hedge short. Should most likely be net long
Annotations and Ideas provided on chart General Idea: Possible Double Bottom, w/ second bottom forming higher low decreased selling on second bottom Price trading in oversold territory (below the channel) Unfilled Gap that also coincides w/ local HVN (not marked)
Presenting a wyckoff accumulation for Bitcoin The main area of focus on this chart is the JAC (jumping above creek) that we see near the bottom of the trading range. Price displayed a change in/of character by jumping over the dynamically forming resistance (made by connecting the peaks of the highs) on noticeably higher volume. This illustrates the market...
Target found via Point and Figure Horizontal Count Box Size of 50, Reversal Size of 3
$SPX Chart Dotted Lines = Wyckoff Support and Resistance based of 1W TF Red Rectangle = 1H Bearish Order Block (supply zone) Bearish divergence with BB%B (have not checked other price oscillators) Traded into 71% retracement (popular, i don't know why) Expecting a drop down to at least 2730.
Confluence of a Rising Wedge and Bearish Divergence on On Balance Volume suggests that downward price action is imminent. Target illustrated is ideally a minimum target. Price could conceivably go lower.
Would be a good idea to short now w/ a stop above the red bearish Orderblock
Chart annotated w/ analysis on the OANDA:EURUSD Note: Take not of current accumulation range for signs of re-distribution to continue current downtrend.
Information on consolidation phases (accumulation and distribution) can be found here: stockcharts.com Distribution bias is given by looking at Monthly and Weekly timeframes
Hidden Bear Divergence w/ BB %B Divergence also exists on higher TFs Divergence exists with a BB %B of length 30 as well Break down of wedge expected before upward continuation to test 8K as resistance, however targets for Bear Flag are presented in case of downward continuation There is a High probability, Low Risk Short Set-Up present, but this post...
901 Shelby Drive, Look Alive Look Alive Wedges
Expecting another leg down on BTC. Currently watching price action to see if a retest of the bottom of the wedge (or reach towards it) will be featured. It is difficult to prematurely put these events in sequence. Best course of action would be to wait for a test of the red line that is currently indicated just above current price and observe the reaction to...
Possible Falling Wedge on BCash. Would expect breakout near 50% fib that has confluence with prior swings highs. The swing highs at resistance may flip into supports which will allow the wedge the break upwards. Target taken from the height of the wedge and applied to the projected breakout point.
Wyckoff Analysis is linked here: stockcharts.com Other commentary is annotated
Currently at a zone that was previously an area of major supply.


