BNAFX
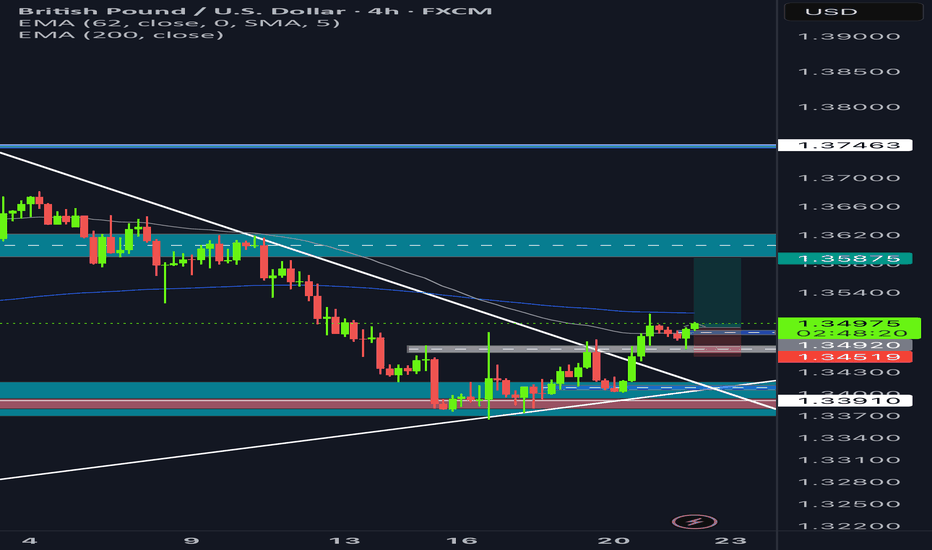
Long opportunity - broke through 4 hr descending trendline - you can see CHOCH where the grey dashed box is - continues bullish now - order block where blue dashed box is - bullish candle engulfed the previous bearish candle ( this is where i entered ) - SL below demand zone - TP at major supply zone
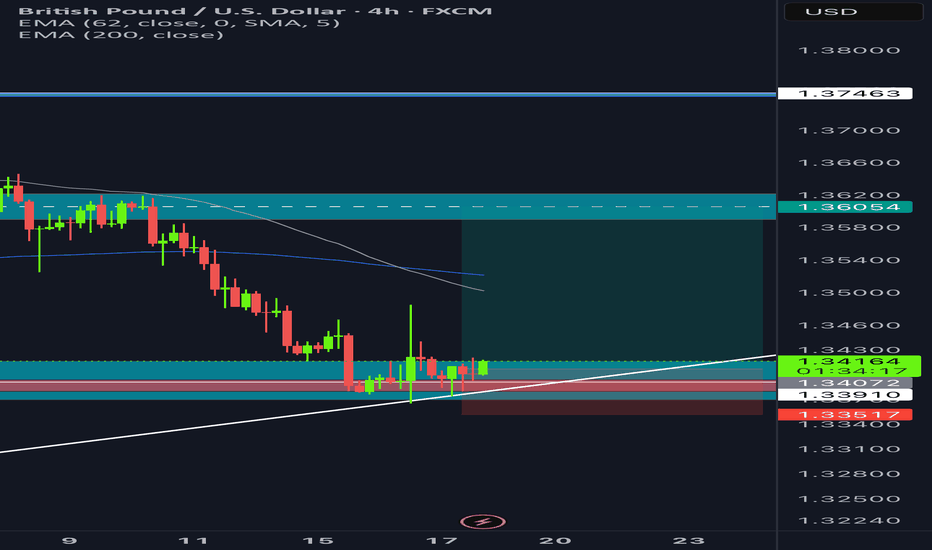
Swing Long opportunity - stalled and ranged around our major demand zone - tested and rejected off our major bullish trendline - bullish engulfing candles forming - double bottom forming ( creating that W pattern ) potential for a reversal - exhausted bearish wicks as you drop down the time frames - SL just below demand zone - TP at next major supply zone
Overall bearish market structure in the higher time frames - High wicks exhausting the buyers ( sellers stepping in? ) - RSI crossing over ( potential for a market direction change ) - Testing Supply zone but failing to break through - Tested Major Fib levels and currently consolidation and unable to break through - Currently in the 30 minute time frame is this...
Potential swing trade SHORT! - Within the daily time frame, we can see it respecting the bearish trendline. is this the retracement towards the downside? - Bearish engulfing candles on all 3 time frames ( Daily, 4HR, 15M ) - overall bearish market structure in the higher time frame - USD is starting to pick up some momentum after a rocky past few weeks -...
Potential long position - Market trend is overall bullish - long wicks on the 4hr major demand zone - tested bullish trend line ( broke through and tested liquidity ) - Bullish engulfing candles - CHOCH ( change of character ) potential continuation of the bullish momentum
Potential long opportunity - Reached weekly demand zone and swept liquidity - Exhausted bearish wicks - are the buyers stepping in - potential double bottom forming ( W patter ) shown by the arrows - RSI divergent showing bullish momentum - possible swing trade to our next major supply zone
Potential short opportunity - reached major daily supply zone - Double top created in the higher time frame -failing to break the highs - JPY gaining strength back - EUR failing to climb - waiting for retest of structure - higher time frame the market structure is bearish
Potential swing trade incoming ( Short ) - creating LLs and LHs - Hitting daily supply line - 3rd touch off the downwards trendline - high wick candles on the lower time frames - sellers are stepping in - SL just above previouse LH - TP at major demand zone - overall downwards trend within the market boost and comment away guys i want to here your take on this trade
Potential for a long position - overall market structure is upwards higher time frames ( D,4HR,1HR ) - reached its daily low - waiting for potential consolidation then a break out back towards the daily high - RSI showing oversold which often means a reversal is about to happen - testing the major demand zone - buyers jumping back in?
potential for a possible swing trade opportunity ( Short ) - Overall bearish market in the 4hr time frame - pair is creating LH and LLs in the 4hr/1Hr - waiting for market to retest FVG and anticipate the movement towards the downside. - bearish and high wick candles confirming sellers are in a strong position - SL just about the previous High - TP at the next...


