B_version256
Hello, Beginning with the 1D chart on CME we can see the birth of Adam and Eve taking place. At the same time we can see a shooting star ready to be confirmed. This points to the possibility of printing a handle for A+E. Also a cross between the 8D MA and 21D MA is about to occur. Below it, we find a gap. Although I believe we shouldn't wait for a gap to be...
Hello, My last analysis for this week #31 was nulled after Bitcoin bounced from $9110. I called for a further dip too soon, and had to go back to my possible double bottom analysis. Price action is above all else, and changed my trades accordingly. After all, we must adapt to any situation. Looking at the 4hr chart we can see that the current tip of wave 5 has...
Hello, I hope everyone had a wonderful weekend. Last week, I mentioned a possible bounce at $9700. We wicked down to $9500 and quickly found support at $9700 for only a couple of days. As expected, this level didn't find strong support. My next level of support was between $8985 and $9100. When Bitcoin broke below the $9700 support, we wicked down and bounced...
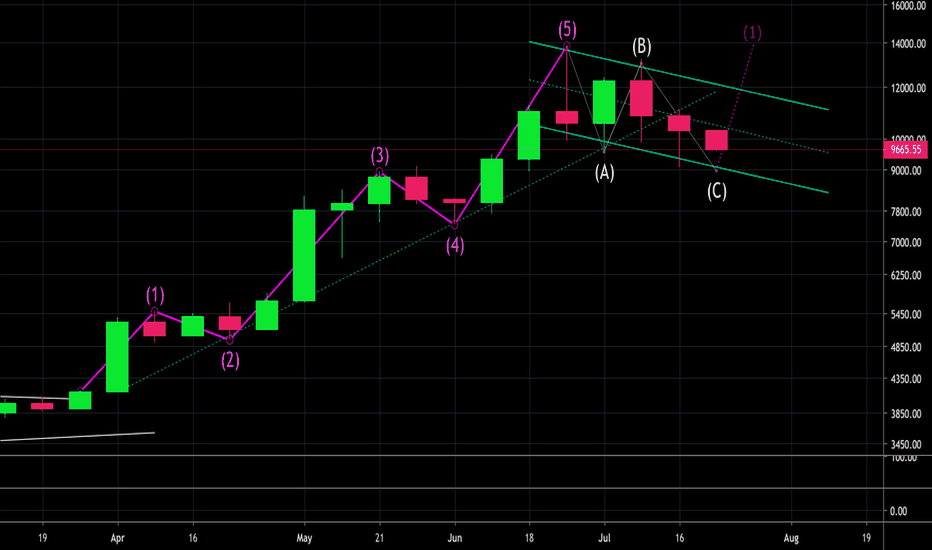
Hello, This is only a test on the Elliot wave principle. I am not too familiar with the theory, yet. However, I am very intrigued and will continue studying it. I did not bring wave c to support at wave 4 because the corrective ABC waves are playing well within the current bullish channel. Any thoughts, suggestions, or constructive criticism is welcome. Thank...
Hello, Looking at the daily chart for BTC, the price has broken below 10k. In my previous analysis, I had $10220 - $10000 as a short term buy day trading range, which was a nice couple of days of trading up to 11k. Now that we have broken below it, we can begin looking at the ranges for a nice Long position. On July 2nd, 2019 Bitcoin printed a bullish hammer...
Hello, Let's start with a macro view. Beginning with the 4wk chart, we can see that a doji star has formed. On the 2wk chart, we are nearing the end of a hanging man. Here, the Money Flow Index is overbought and heading down. The MACD is also showing signs of weakening. Zooming in closer, on the weekly chart, we can see a bull flag formation. The bottom of...


