Babenski
Premium#ENA / USDT Iam expecting big returns from ETH and its related coins in this season This chart is also looking good Another Potential round bottom pattern under formation Keep an eye
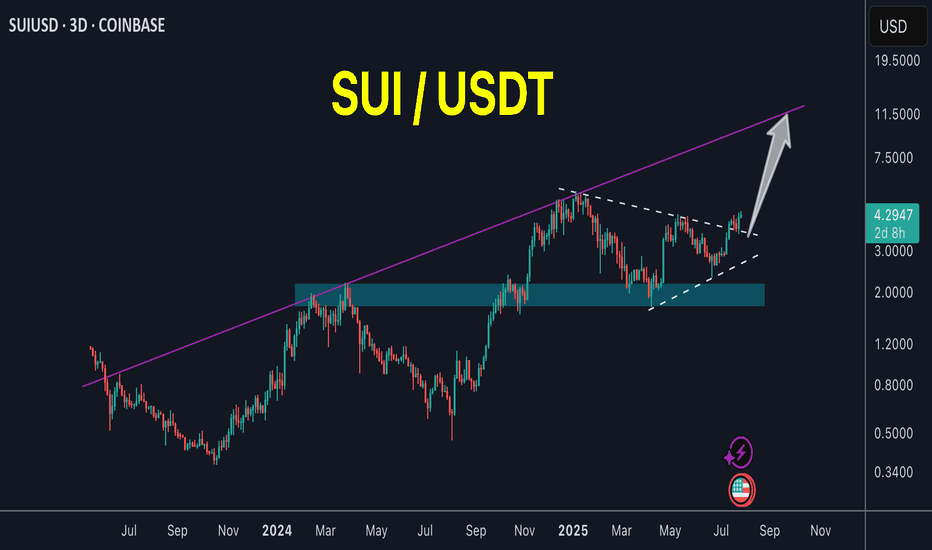
SUI / USDT Price broke out after long accumulation range with good volume Looks like a new bullish trend has started
ETH / USDT 📌 Background: i shared an analysis about ETH/BTC chart and i predicted the ultimate bottom, from which ETH/BTC pumped 52% and ETH/USDT pumped 97% in few days ! you can check previous analysis: click here 📌 Today we have different chart against stable coin … Ethereum is being accumulated since 5 years in mega accumulation range with 2 major...
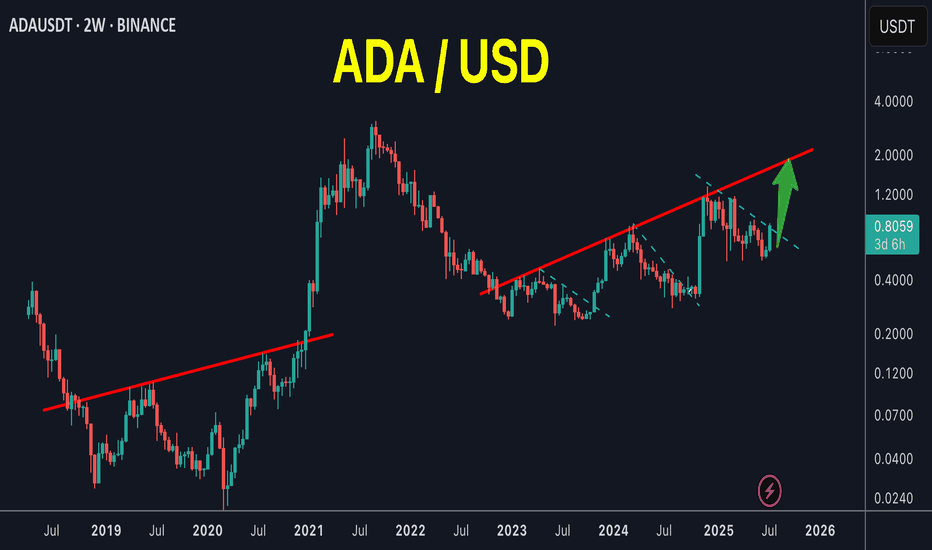
ADA /USDT ADA keeps repeating its old patterns as it’s clearly obvious in my chart Breakout is going on lower time frames Looks like an easy 2X
PEPE / USDT Price is trying to breakout massive downtrend line since 7 months Incase of breakout we will see strong bullish momentum Keep an eye on it
LTC / USDT 8 years of accumulation in this triangle and price is being squeezed around apex.. What is the result of this long accumulation? It reminds me of XRP chart before the big breakout in last November Keep an eye of it…
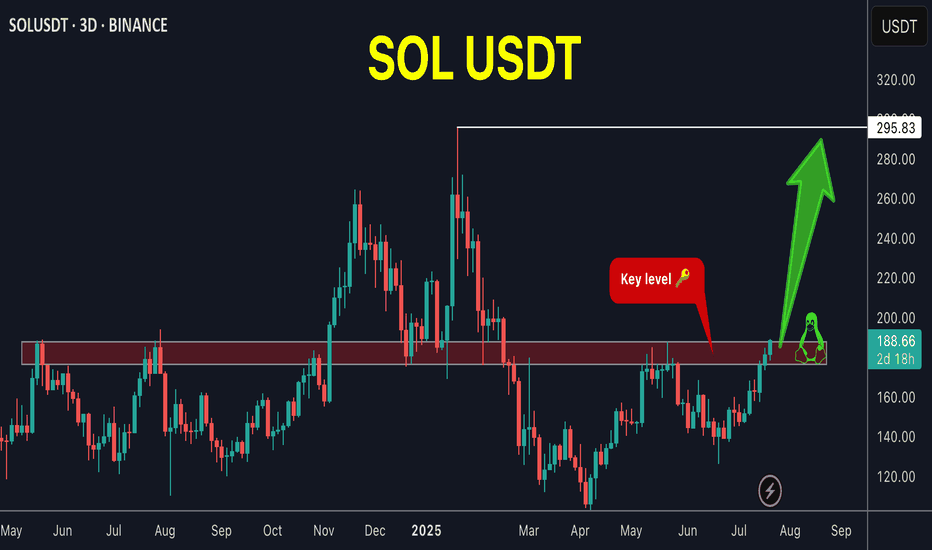
SOL / USDT Solana didn't make a move since long time but i think its time will come very soon Currently SOL is trying to breakout the most important key level in chart Breaking out here => very high chance of making a new ATH For those who interested in SOL …its the time
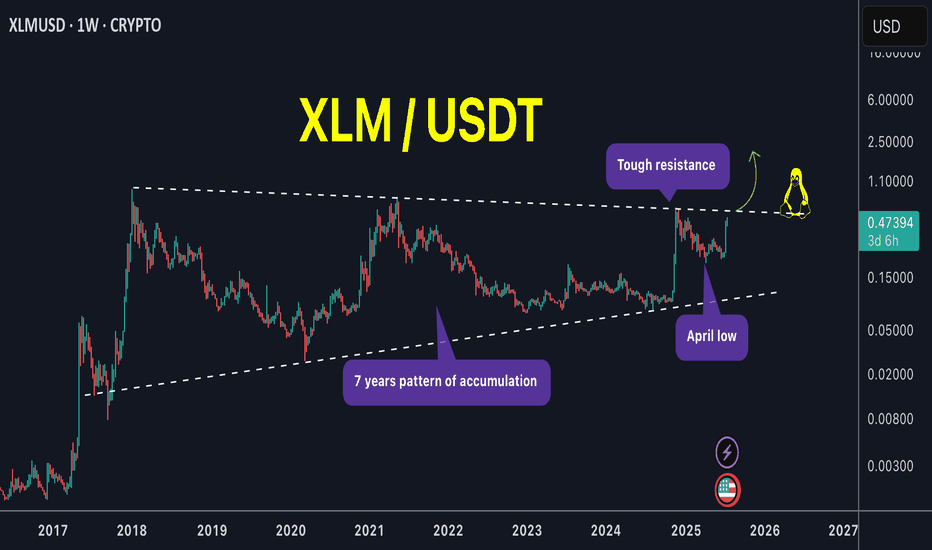
XLM / USDT What a huge weekly candle! We catched its strong move very early around 0.29$ a week ago (75% profits locked in spot) With a zoom out chart we can see price is setting up nicely with several tests of pattern boundary. Next test of the upper boundary can lead to huge breakout of this mega pattern ! NOTE: Price must not close below april low and...
XRP / USDT XRP is on a long retest after breakout of accumulation zone weeks ago successful retest here will result in strong bullish rally ! Keep an eye on it in the coming days 👀
COMP / USDT 3 years of accumulation and volume start to enter again Just imagine if it breaks out from this long accumulation, the target will be very high but first we must breakout this accumulation box Best of wishes
SEI / USDT Price is trading inside big descending channel Next stop : price will hit the upper trendline of the channel and if managed to breakout this resistance it will skyrocket maybe to new ATH Keep an eye on it …
APT / USDT Price dropped hard to retest the massive historical support again This multi years support ( 3$-4$) zone always shows great buying pressures thats why it catch our attention! This support also can play as DO or DIE borderline between bulls and bears The buyers must defend this area otherwise it will die and make new lows Keep an eye on it
XRP / USDT Xrp is forming small flag pattern above previous big accumulation zone Looks like a breakout could happen soon Keep an eye on this chart and trade / follow accordingly Best of wishes
ETH / BTC If you checked this chart you will notice that ETH was in downtrend and bear market against BTC since 2021 ! Now we have reached a very important multi years support (price action on 2020 - 2019 - 2016 ) Time for bounce soon ?
ARB / USDT The Price printed the strongest weekly candle at horizon trendline after Series of downtrends such price action support the idea of being the bottom ! What next ? Possible playout in coming weeks we see the price hit the recent high of December and after that if bulls continue showing their strength may hit the next target in my chart Best wishes
TAO / USDT Potential double bottom in HTF looks like it will go to supply zone in my chart After that if breakout happens it will continue fly to the target of this pattern 🎯 Keep following this chart
XRP / USDT Price has been accumulating in perfect falling wedge since December A breakout here could make a big rally Keep an eye
DOT / USDT The price just toke the liquidity and come back above the most important suppprt level in dot chart with long green wick (strong buy action) As long as the price continues to close above the current level we think for strong bounce in the coming weeks However, if and only if the price lose this level on HTF DOT will make new lows Conclusion: ...


