BTC / USDT Since mid June price is just moving in slow and boring sideway and forming a contracted triangle pattern Which is a result from bulls and bears fight But soon we will see big move : A Breakout to upside: Might pump the price toward 22k - 24k A breakdown from the pattern : Will dump the price towards 18k - 16k 4H chart : Which side will...
BTC / USD Bitcoin is showing some stability here and holding above yellow trendline as long as BTC above support we can see 22k-24k before heading down Losing trendline = direct dump Share your opinion about BTC in comment section below Best of wishes
BTC / USD hi guys before we get started lets say this scenario has a very little chance to happen However we should be prepared to everything I can call this scenario “worst case scenario or the scariest scenario “ WHAT IF ? as i said before in my last analysis i still believe we have very high chance around 17600-16000 will be ultimate bottom , you...
BNB / USD BNB is testing its major support around 200$ Many tests recently only mean the support gets weaker and weaker It’s situation looks like ETH at 1700$ if this support (200$) lost , next one will be 130$ and after that too much low inside old channel range up to 20$ ! Will the support hold ? Comment below
BTC / USD BTC about to reach major support 32k - 28k F&G index dropped to extremely fear Whats the plan ? From current major support I expect market will do temporary bounce (alts will follow for few green days or few green weeks before next crash ) In the chart you can see : Major support 32k-28k i think MM will break this level sooner or later to hit...
BTC / USDT Bitcoin is still following my first plan , posted here: Since last November BTC price is trading inside giant falling wedge which mentioned before In small time frames we can see potential bearish pennant under formation which mean we have high chance for another drop WHAT NEXT ? I expect the market to move sideway up and down in next days...
ETH / BTC ETH brokedown the important support level against USD today (1700$) which open the way to test 2018 ATH 1 month ago , I sent an alert about the weakness in market you can check here : Today ETH just reached bears target against USD of my previous idea But here in ETH/BTC its looks like there are more room for bears up to 0.04 BTC ! (The...
ETH / USDT Its look like all major crypto have same view ETH as well in critical situation ! Too many tests of major uptrend support But still the last hope for bulls here If this support hold expecting bullish wave towards upper boundary of rising wedge If failed = back to breakout point 1700$-1400$
XTZ / USDT Price broke-out the bullish pattern on its fifth try the overall market still in bear/ sideway However this is bullish momentum for XTZ if price able to hold above resistance line for next few hours expecting more bullish movements and first resistance is around 2.55$ (first TP ) Best of wishes
BTC / USDT On weekly view BTC is bouncing from 200W EMA and currently is retesting the previous strong S/R This area mainly for watching Scenario 1: Breakout Make strong breakout and close weekly above 36k then we can see new bullish move again Scenario 2 : bearish retest If we see strong rejection here with loss of 28k again this time i think we...
BTC / USD BTC just made 8 red weekly candles in row for first time in history In small time frames : BTC is showing some stability after making double fakeout to take stoploss of both long and short traders WHAT NEXT ? A new week ahead and we are looking for bulls action here After breakout of current trading range we will have high chance for a jump...
BTC / USD I think BTC still following my idea that I published on 14th april price finally hit 37k (second support line in my chart ) You can check my last idea here : WHAT NEXT ? From here I expect Bitcoin to test first support of channel which turned to resistance now (around 41k) The price action there will determine the next move : 1–If price able...
BNX / USDT Another interesting coin in this red market ! BNX printed a bullish structure : Bull flag above S/R zone Invalidation : lose support zone (blue color ) This idea for educational purpose
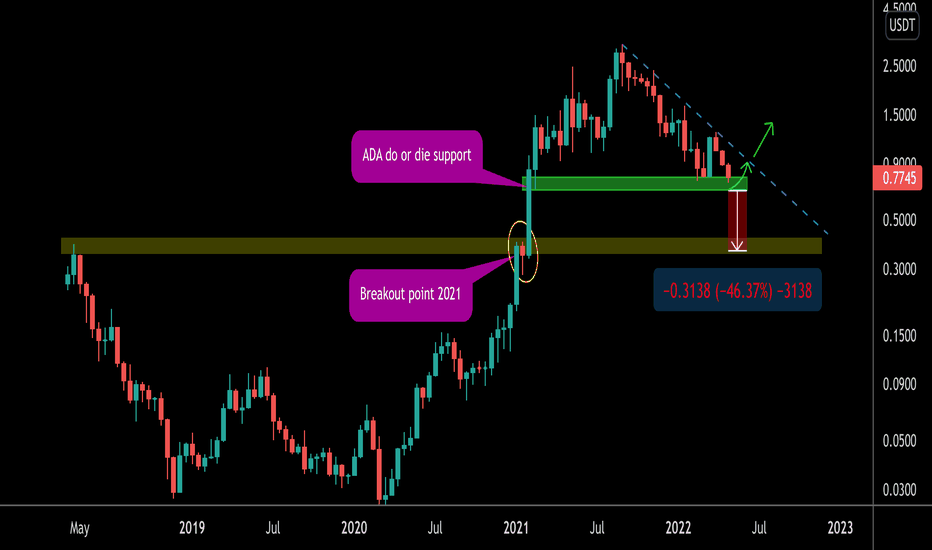
ADA /USDT Ada currently trading at very important area This area we call do or die If bulls not active here there is no much support until 0.4$ (breakout point of 2021) What do you think? .. share your opinion below
Last defense area in this range around 1$ If bulls not active here except another 40% drop toward 0.7$ - 0.5$ Keep an eye reaction on this area (candles closing)
ICP / USDT ICP is moving inside this falling wedge for almost 1 year I think yellow box will be a good buy area toward resistance and if resistance broken this could be parabolic RSI looks good too Watching this in lower time frames and wait the bulls action
DOGE /USDT IN HIGH TF DOGE another try to breakout from falling wedge after full year in downtrend inside it (due to news of elon musk buying twitter ) Here you can see price is just testing 200D moving average (a close above it can be bulls sign) : If price broke and sustained above the resistance expecting massive bullish wave Invalidation: lose of...


