Badcharts
ExpertNot sure what all the fuss is about platinum. When I see platinum's performance against the stock markets, I can clearly see the bull era has NOT started yet. Still soo very early...
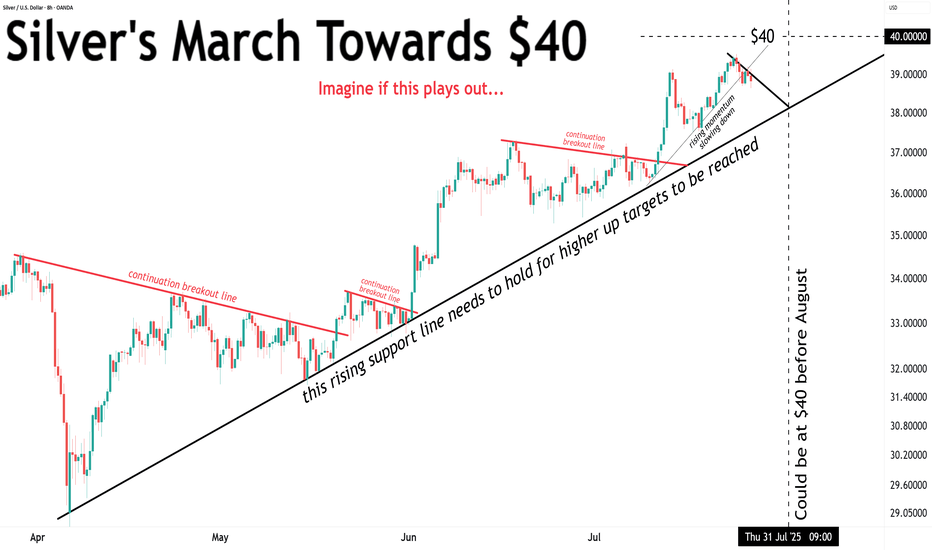
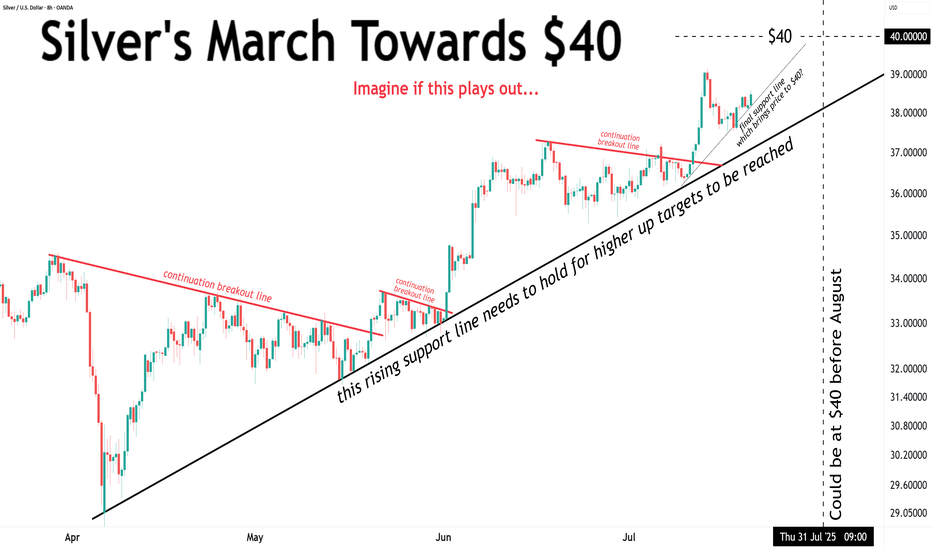
Silver came very close to the $40 target ($39.52). Currently in correction mode. Nothing to see here... for now.
It’s nonsense to review the Bitcoin chart on a linear scale. I drew equivalent rising support lines on both scales: 📉 Linear support = $27K 📈 Log support = $52K The difference is massive. Log scale reveals reality.
Since December, Apple LOST 37% of its value (priced in silver). You should NOT be seeing this happen in a bull era for the tech giant.
When both 2s & 10s drop together and the yield curve steepens (10–2 rises)... It’s historically followed by important market turmoil Happened in 2000, 2008 and 2020. It's possibly happening again. The bond market is warning us.
Don’t be fooled by the first crash… The worst drops often come later in a bear market. Let’s break down the brutal truth about the 2008 GFC and what it teaches us today. 🧵 1. In the 2007–2009 bear market, the S&P 500 had 7 failed rallies before finally bottoming. Every bounce looked like the bottom — and every one was a trap. 👇 2. The early drops were steep: 🔻...
Just so we are clear... The long term prospects for silver are STILL bullish. Once $48 is cleared, $85 becomes the next target.
That’s it, folks. Silver came very close to $40… but lost steam. We’ve now closed below the rising support line. Momentum has broken. The correction deepens.
Tech stocks are still not out of the woods, priced in gold. Right now, it looks like a BIG TOPPING pattern morphing into existence. No man's land.
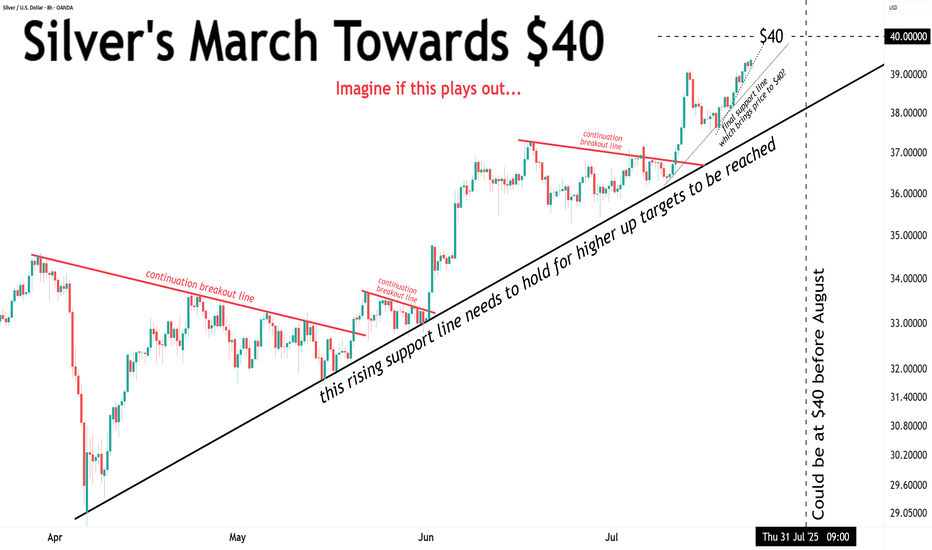
Silver’s short-term momentum is slowing down... Will it have enough juice to crack $40 before August? 🍿🍿🍿
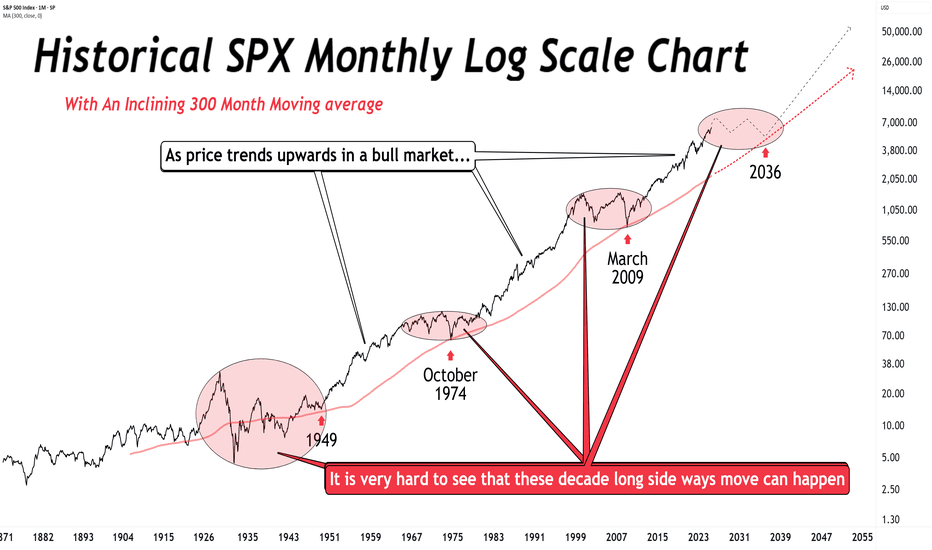
Before the perma-bulls go bonkers… no, I’m not calling for a crash or bear market (yet). But longer this bull runs, greater the odds of mean reversion. Further we drift from 2009 without tagging the 300-month MA, more likely a sideways decade begins. This will happen again. You can't say we are "early" in the bull market. That simply is not true. Early is in...
So how many times has silver touched or broken $40? ONLY TWICE !!! • 1980 – short spike • 2011 – brief sustained rally Didn’t end well either time, both marked the end of bull markets. But this time? No mania. Just stealth. Silver’s quietly moving up.
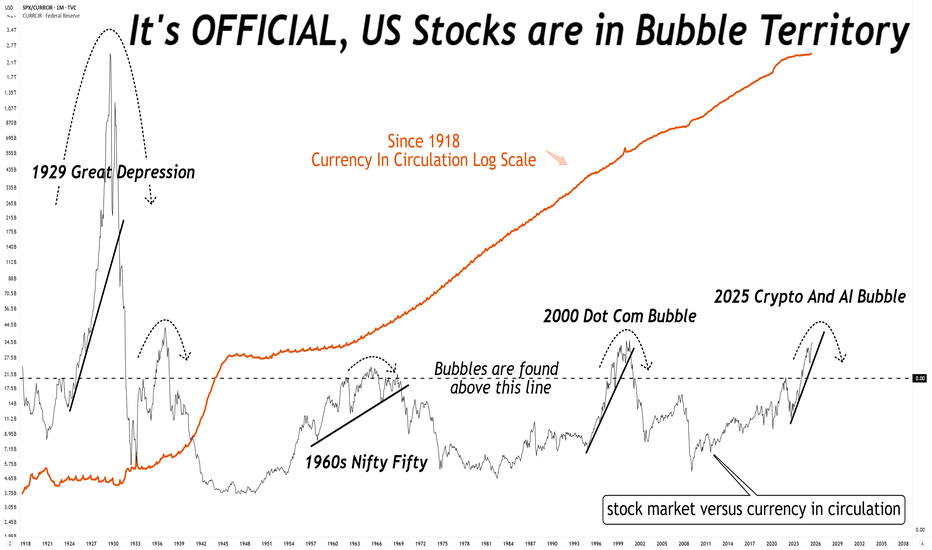
What do you mean the stock market is not in a bubble? No, it is not different this time, there is always a reversion to mean.
Silver is VERY close to $40. Can it reach that target before August?
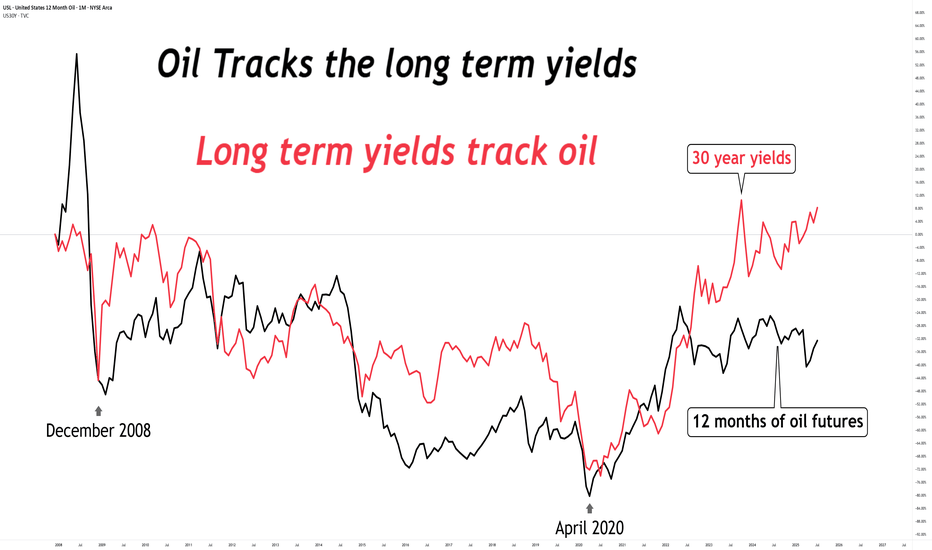
Looking at this chart... Where do you think oil & long term yields are going?
Silver is pushing towards $40 !!! Looks like the breakout bulls have been waiting for ...
The anvil is tightening... Approaching a resolution which will answer the question: "Will silver hit $40 before August?"


