Buy once and enjoy life. Just one check per year.
The beast is slowly awaking... 68$ target before 2028.
Other than a liquidity crunch provoking a US Dollar spike, a long term sustained US Dollar implies rising Fed fund rates. Will that happen? #usdollar #dxy #gold #fedfundrate #debt #inflation
Which setup is most likely? Looks like 2004-05 wins! But since current arc is tighter than the one 2004-05 was breaking out above, the consolidation should resolve faster. Note, all resolved UPWARDS!
34-51 months for GSR to reach 47 once 81 is breached from above. 6 months in now...
Sep 2022 or Nov 2024... GSR will touch 47! Now 6 months in. Note, there is the 2016 case where 81 was touched from below, and didn't go back to 47 straight away.
M2's distance from 1 year moving average is closing in... which signals possible bottom for gold.
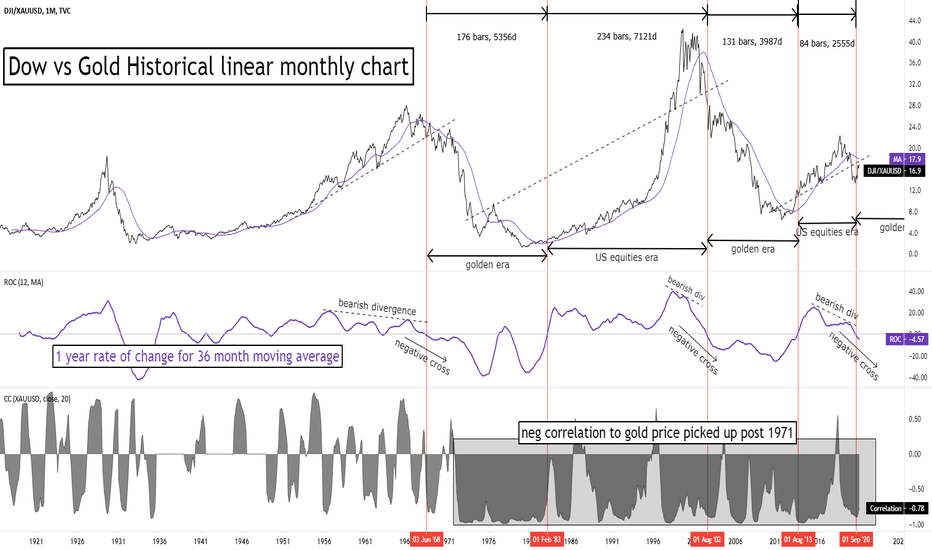
Another challenge for gold bears out there to debunk this chart... Stay civilized please!
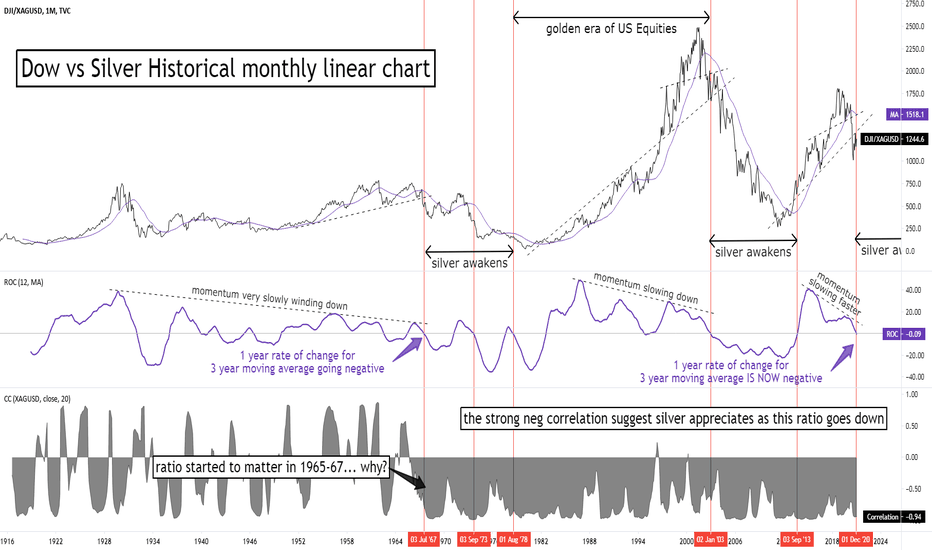
Silver bears, please debunk this.
Patience is a key. Not blind patience, smart patience. Let the market tell you when the show is over. #gold #silver #fintwit $slv $gld Is gold 5 months in or 116 months in this bull market? Also consider we corrected for 7 years. No more energy left?
Holy smokes! Most bearish chart I've shown yet!
Need more time... again!


