LINK with volume candles and OBV, looking like a failed breakout. Low volume throughout the inverted h&s. It's gotten above the AVWAP from ATH but has stronger volume selling into the retest. I wouldn't be surprised to see it come back to 12.80-14.50.
DBA agricultural commodities ETF and the sentiment cycle. Potentially at the aversion stage.
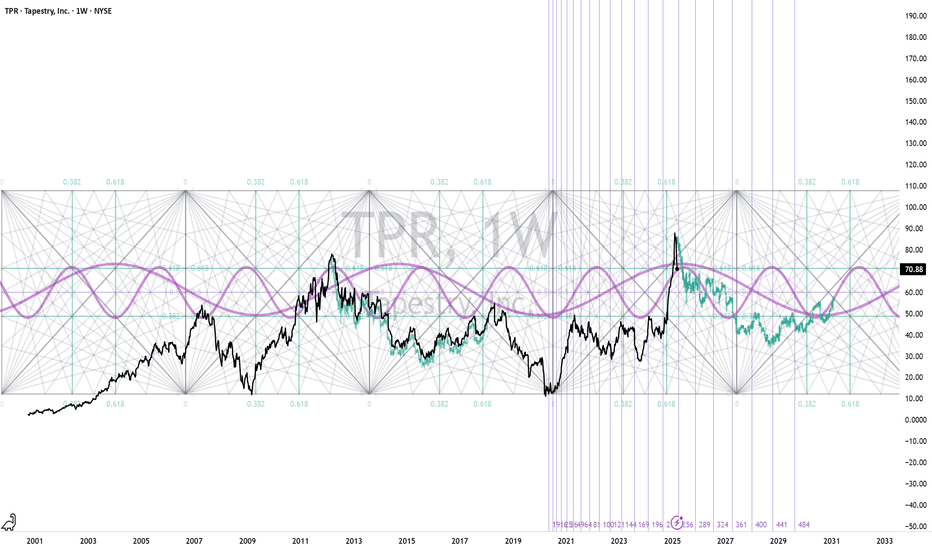
TPR exhibits a relatively clear cycle on the weekly time frame. A consolidation from this area is likely.
Failed bullish formations become strong bearish moves. The proportional range to forecast a bullish break above the base becomes the forecast for a the low of the failure. Someday I'll see one of these in time for a massive short. Note that the forecast is in between the 1.272 and 1.414 of a fib retrace anchored to a momentum crossover. They are also nearly...
OKLO is breaking out of a consolidation. The nuclear stocks could see a continuation of strong momentum this year. I cover this one in more detail in the stubstack in my profile.
NYSE:VRT with a strong break above the AVWAP from its all time high and a test in proximity to the prior base. If interested, I have more detail on this and other names in the substack in the links in my profile.
Crude oil and the CBOE OVX oil volatility. Breaks from the trend in volatility are followed by a change in trend (either change in direction or accelerating rate of change to current trend). The good news is that the fib time zone has lined up with pivot points. The bad news is that the next one is Feb 2026.
NASDAQ:MSFT looks fantastic. I like the pattern here: bullish crossovers on KST and Chaikin, KST breaking above a descending trendline, consistent movement along upper daily BB, and daily BB breaking out of the weekly BB. ADX doesn't fall to 10 frequently. 9 times since 2015. All instances were higher within 100 sessions, averaging 18% performance. 23%...
AMEX:SPGP offers two potential paths, depending on which formation it takes. Trend and conditions suggest continuation. But the structure allows for a very tight stop at ~105
NYSE:PLTR has had an amazing run. It seems to love filling proportional measured ranges. We're likely halfway through this move before another consolidation period.
URA completed the full projected drawdown from the inverted head and shoulders. Purple lines are fib confluences using Connies method. The composite index shows favorable momentum. Volatility weighted MACD has a signal crossover. And Martin Prings concept of total return (rate of change + dividend)/(3 month commercial paper) has a signal crossover. Uranium has...
FX:USDJPY USDJPY The bullish divergence in on the composite index immediately after bearish RSI crossover is usually when we see a short wave B up
NYSE:LLY LLY looks like it will head lower. Support at the dotted lines on the composite index have marked bottoms, but failure has seen continuation. We have a break below the BB and LMACD roll over. ~784 and ~808 align to AVWAPs anchored to gaps and fib confluences. ~784 aligns with support on the volume profile.
CRYPTO:FETUSD The volume-weighted moving average (VWMA) anchored to the October 2023 momentum breakout has acted as support. FET is now testing the Anchored VWAP (AVWAP) from the beginning of the December 2023 consolidation. When it cleared this AVWAP in February, it went on to make a 400% move to the March high. FET has also reclaimed its 21 VWMA and 200 SMA....
BTC's 18 month uptrend started w/ the inverted hammer on 1/9/23. Green AVWAPs tied to that candle have been great buying opportunities since. Including now we have 7 full rollovers in the composite index, followed by 5-22% drawdowns. 5 of these drawdown far enough to test one of those AVWAPs. Price is currently at the 0.786 retrace from the last test of the...
NASDAQ:ADBE recently retraced to support at the 0.786 fib from the move to the February high and then gapped up today on a positive earnings. This likely to begin a 5th wave up that could take months to play out, similar to what we saw in 2021. We can see several instances of it respecting key levels from 2021 fib retrace in the first two waves up in...
NASDAQ:ADBE recently retraced to support at the 0.786 fib from the move to the February high and then gapped up today on a positive earnings. This likely to begin a 5th wave up that could take months to play out, similar to what we saw in 2021. We can see several instances of it respecting key levels from 2021 fib retrace in the first two waves up in...
NASDAQ:ADBE recently retraced to support at the 0.786 fib from the move to the February high and then gapped up today on a positive earnings. This likely to begin a 5th wave up that could take months to play out, similar to what we saw in 2021. We can see several instances of it respecting key levels from 2021 fib retrace in the first two waves up in...


