BenjaminFib
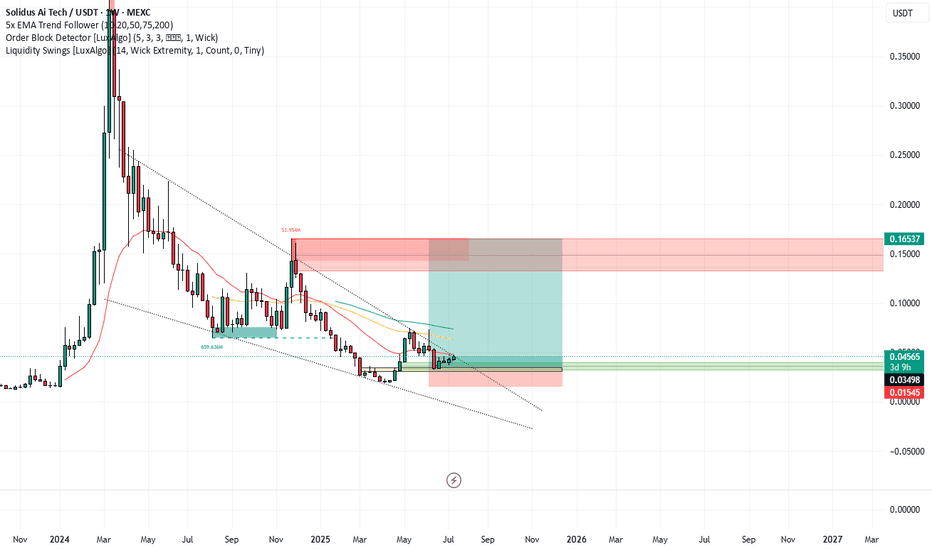
EssentialBreakout falling wedge? Market structure Order block Binance alpha
1. Identify the Pattern Spot a narrowing wedge with lower highs and lower lows. Look for decreasing volume as the pattern develops. 2. Wait for a Breakout Entry is above the resistance line (upper trendline). Some traders wait for a close above the trendline or a retest of the breakout level. 3. Set Entry Buy at breakout or on the retest of the broken...
A bull flag consists of two key parts: Flagpole: A strong, nearly vertical price rise with high volume. Flag: A short-term consolidation or slight pullback that slopes downward or moves sideways on lower volume. It resembles a flag on a pole — hence the name.
A broadening wedge is a chart pattern where price action forms higher highs and lower lows, creating a widening structure. There are two main types: Broadening Ascending Wedge – Bullish bias (eventually breaks up). Broadening Descending Wedge – Bearish bias (eventually breaks down). Key Characteristics: Appears during high volatility. Shows increasing price...
Trading the Rising Wedge Pattern Trading the rising wedge pattern involves strategically capitalizing on its bearish reversal signal. Here's a common set of steps to go about it: 5 Identification: The first step is to identify the rising wedge pattern on the chart. A trader or investor would look for converging, upward-sloping trend lines with higher highs and...
Pull back Fib Levels on weekly timeframe if swing is to occur here. Align with MS, EMAS, TL, Candle Formations etc
Bear flag trading is a technical analysis pattern used by traders to identify potential continuation of a downtrend in the financial markets. The pattern consists of two main components: Flagpole: This is the initial sharp decline in price that creates a steep and rapid movement downward. It represents the strong selling pressure in the market. Flag: Following...
Long-term trading in forex, often referred to as position trading, involves holding forex positions for extended periods, ranging from several weeks to several months or even years. This strategy aims to capitalize on significant price movements and long-term trends in currency pairs rather than short-term fluctuations. Key Characteristics of Long-Term Forex...
The inverted head and shoulders pattern is a technical analysis chart pattern used in trading to predict a reversal in the trend of a security, typically indicating a shift from a downward trend to an upward trend. Here’s a detailed breakdown: Structure of the Inverted Head and Shoulders Pattern Left Shoulder: The price declines to a trough and then rises. Head:...
A rising wedge is a technical analysis pattern in trading that typically signals a potential reversal in the current price trend. It is characterized by a price pattern where the highs and lows of the price action converge, forming an upward-sloping, narrowing range. Here's a detailed explanation: Characteristics of a Rising Wedge Formation: The rising wedge...
Trading the Symmetrical Triangle Identify the Pattern: Recognize the symmetrical triangle on the price chart by connecting the series of lower highs and higher lows. Wait for the Breakout: Do not enter a trade until the price breaks out of the triangle. A breakout is confirmed when the price closes outside the trend lines, either above the upper trend line or...
Shape and Structure: The falling wedge is a converging pattern where both the upper and lower trendlines slope downwards. The upper trendline, which acts as resistance, is steeper than the lower trendline, which acts as support. The price action within the wedge shows lower highs and lower lows. Volume: Volume tends to decrease as the pattern develops,...
In trading, a "triangle breakout and retest" refers to a technical analysis pattern involving a triangle formation on a price chart, followed by a breakout and a subsequent retest of the breakout level. Here's a detailed explanation: Triangle Patterns Triangles are continuation patterns that indicate a period of consolidation before the price continues in the...
An ascending triangle is a chart pattern used in technical analysis to predict future price movements. It is formed by a horizontal line at the level of resistance and an ascending trendline connecting higher lows. Here's a detailed explanation: Structure of an Ascending Triangle Resistance Line: This is a horizontal line that indicates a level where the price...
1. Weekly Fib on Daily Timeframe 78.6%, 3x rejections. 2.Bull Flag into consolidation of Bullish triangle. 3.EMA Compression looking likely to push price action. 4. AI Marketplace June. 5. AI HPC Data Centre July. 6. Weekly oscillators bottoming. 7. Solid Market stucture & hold. 8. Break out of Symmetrical triangle. 9. MC 23/05/24-$112M. 10. MC to Reach...
Confluences as per previous chart post 78.6% fib retracement daily market structure expansion of channel ema multi daily support vmc cash injection green ball rsi low mac d due for overchange volume pending 2 day ema 50 support weekly ema 20 support weekly fib 23.60% showing support multi bullish convergence on multi timeframes Indicators
falling wedge 61.8% fib retracement market struture expansion of channel ema 75 daily support vmc cash injection green ball likely rsi low mac d due for overchange volume pending 3 day ema 20 support weekly fib 23.60% showing support multi bullish convergence on multi timeframes Indicators


