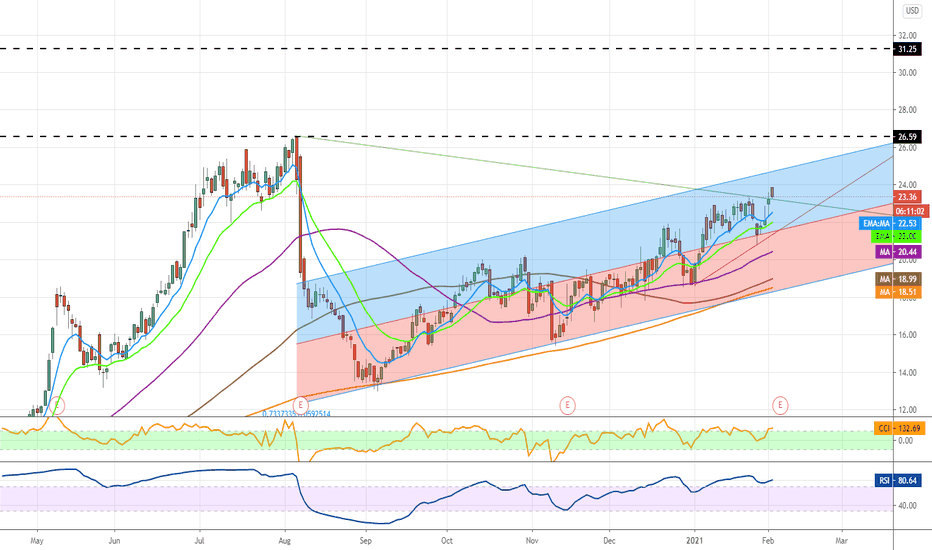
VIVO is up +35% since it last reported earnings. The latest ER is scheduled Feb 5, 2021. The Bullish Signs I like here: 1) Diagonal Trendline Breakout to the upside (ascending channel) 2) Price is trading in the Bull Zone of Linear Regression Channel 3) CCI is above 100 but under 200 4) Candles are curling up to form a cup-like breakout pattern on the daily...
$DOGE.X is sitting at a key resistance level. If price breaks above .00958730 and holds, it could retest previous highs. Key levels (my personal targets) are marked on the chart (black dashed lines) with a stop loss @.00824378
Strong channel breakout + above 50 day moving average is a great sign. Congrats to the Bulls who timed it perfectly. If the 50 SMA holds, this could run higher. The RSI is just above 60 and earnings announced Feb 18th (per Earnings Whispers). My profit targets are marked on the chart (dashed lines)
Look at how the price on $ZM reacted when CCI previously broke into the green box. I would add this one on my watch list for the reversal. Especially if it trades above $342. If this occurs, my price target is $375 then $389. I've marked some key pivot areas on the chart to watch intraday. If price opens below $336, you can take a short trade to the support...
Hourly chart is currently trading below the 200 SMA. If price falls below the red line, I expect sellers to push it further down into the 130s.
$NIO gapped up yesterday and is pushing to test previous resistance (57.20) Double Top? Watch price action closely. With CCI up so much, price may turn sideways as it pulls back into the green box (e.g. marked in yellow) If price breaks below yesterday's low of 50.67 and goes under, I will look for a reversal near the $48 zone. Good luck!
I anticipate a pullback to test the 0.1150 area (purple box). My long targets are plotted on the chart. A break of the RED support line = price may move back to lower support .0095. Therefore, .108 is my stop loss.
Popped Off EMA 9 and has broken out of resistance and is moving higher. I've marked my targets on the chart.
Watching this one closely on Monday. The trend should continue. However, a pullback to support is possible before a bounce higher. My targets are marked on the chart.
Bouncing off the 20 EMA and closing inside of previous bullish candle. If price breaks below 135 (purple box) = downside risk. Price action would drop. However, I'll be watching to see how price reacts to vaccine rollout news pre market. Could form a "W" reversal pattern.
$NDSN put in a bearish engulfing candle on Friday. I'm watching to see if we break below the trendline. If so, price may pullback to the 198-200 range before moving higher.
Price has held support going into the close on Friday. Price should retest the previous high of 3.22 and push higher towards 3.50 in the near term. Stop loss: 2.70 1st PT: 3.22 2nd PT: 3.45
ALGO/BTC is heading back to retest R1 resistance. We expect it to push another level higher. If it moves with strong volume, higher targets are marked on the chart.
I have this on breakout watch. Looking to see if price runs above 24.86. With no resistance above my target is 29.25. However, if price breaks below key intraday support levels I'll look for a pullback and consolidation before moving higher.
Volume is up +234% compared to typical volume over the past 6 months. Price needs to hold above $35 or it may pull back to retest $33. It we continue higher, my targets are marked on the chart.
Boeing (BA) to recognize charge and increased costs in second quarter due to 737 max grounding; amounts relate to expensing of estimated potential concessions and other considerations to customers and impact of continued lower 737 max production rate; said charge will result in a $5.6B reduction of revenue and pre-tax earnings in quarter and will record an...


