Bithereum_io
PlusMany of you have been asking about #COMP. It needs to hold the triangle’s support line and ideally reach above the daily SMA100 as soon as possible — only then can we expect a potential bullish move. In any case, if a breakout occurs above the triangle resistance, the upside targets are: 🎯 $56.17 🎯 $62.55 🎯 $68.94 🎯 $78.04 🎯 $89.63 ⚠️ As always, use a tight...
#MEME has formed a Cup and Handle pattern on the 8H timeframe. It has bounced nicely off the SMA100, and volume is showing signs of strong accumulation. 📌 Consider entering this coin only after a solid breakout above the resistance zone. If the breakout occurs, the potential targets are: 🎯 $0.002369 🎯 $0.002675 🎯 $0.003064 ⚠️ As always, use a tight stop-loss...
#CAKE broke above the ascending triangle resistance, but due to Bitcoin's drop, it pulled back inside the triangle. 📌 If you're looking to enter, consider placing a buy order near the support level at $2.439. In case of a bounce and a breakout above the triangle resistance, the upside targets are: 🎯 $3.106 🎯 $3.581 🎯 $4.186 ⚠️ As always, use a tight stop-loss...
#LINK has broken below the neckline of the double top pattern on the 12H timeframe. 📌 Place your buy orders near the key support levels: $15.90 – $15.42 If the price reclaims the neckline and breaks above it, the potential upside targets are: 🎯 $18.96 🎯 $20.28 🎯 $21.54 ⚠️ As always, use a tight stop-loss and apply proper risk management.
#GNS is consolidating just below a key resistance zone on the daily chart and has formed an ascending triangle pattern. We plan to buy at the current level and again near the $1.630 support level or the support zone in case of a breakdown below the triangle. If a breakout occurs above the resistance zone, the potential upside targets are: 🎯 $2.098 🎯 $2.284 🎯...
#FTT has formed a falling wedge pattern on the daily chart. For a bullish scenario to play out, it must break above the resistance cluster, which includes the wedge resistance, the Ichimoku Cloud, and the daily SMA100, with strong volume. If that happens, the potential targets are: 🎯 $1.1623 🎯 $1.4424 🎯 $1.6475 🎯 $1.9046 🎯 $2.2782 🎯 $2.6517 ⚠️ As always, use a...
#MAGIC is moving inside a symmetrical triangle — it's decision time: breakout or breakdown? If it manages to break above the triangle resistance and the daily SMA200, the potential upside targets are: 🎯 $0.2214 🎯 $0.3187 🎯 $0.3973 🎯 $0.4759 However, in case of a breakdown and a daily candle close below the triangle, it may retest the support level at...
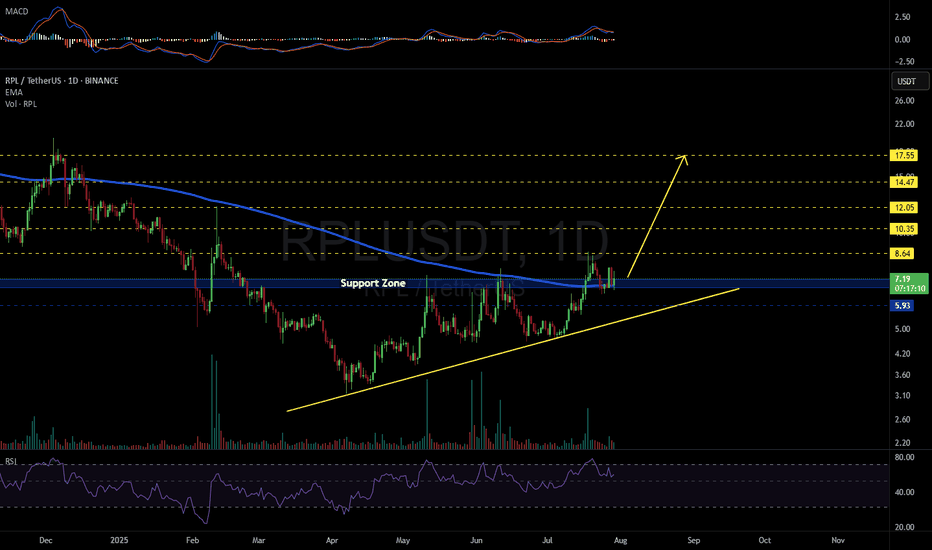
#RPL is currently sitting on a key support zone, which is further strengthened by the daily EMA200. If the daily candle closes above this zone, we expect the bullish momentum to continue. In that case, the potential upside targets are: 🎯 $8.64 🎯 $10.35 🎯 $12.05 🎯 $14.47 🎯 $17.55 However, if BTC drops further and BTC dominance rises, causing RPL to lose this...
#SPX has broken above the Cup and Handle pattern, and based on the RSI, there's a high probability it may retest the neckline once again, which now serves as a support zone. 📌 In case of a bounce from this level, the potential upside targets are: 🎯 $2.3693 🎯 $2.7724 🎯 $2.9829 🎯 $3.2852 🎯 $3.8514 ⚠️ As always, use a tight stop-loss and apply proper risk management.
#AI is moving inside a descending triangle pattern on the daily chart and is currently holding above the daily SMA50. 📌 Consider buying at the current level and again near the support zone if the SMA50 is lost and a daily candle closes below it. In case of a breakout above the triangle resistance and the daily SMA100, the potential upside targets are: 🎯...
#ALICE is moving inside a descending triangle on the daily chart. It’s currently trading below the moving averages, and the RSI suggests the potential for a retest of the $0.3833 support level or even the broader support zone marked on the chart. 📌 The best areas to place buy orders are near these key support levels: 🔹$0.3833 🔹$0.3490 🔹$0.3263 In case of a...
#CAT has formed a Rounding Bottom Pattern on the daily chart. Consider entering this coin only after a clean breakout above the resistance zone. In the meantime, it may retest the support level at $0.000009809. In case of a successful bounce and breakout above the neckline, the potential targets are: 🎯 $0.000014456 🎯 $0.000016984 🎯 $0.000018304 🎯 $0.000020200 🎯...
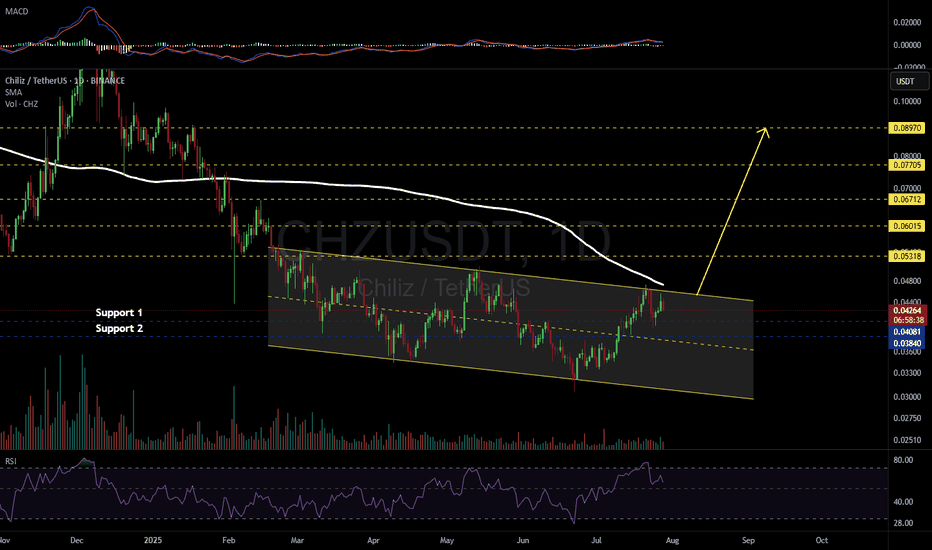
#CHZ is moving inside a descending channel on the daily chart. Consider buying near the support levels at $0.04081 and $0.03840. In case of a breakout above the channel resistance — and more importantly, a break above the daily SMA200 — the potential upside targets are: 🎯 $0.05318 🎯 $0.06015 🎯 $0.06712 🎯 $0.07705 🎯 $0.08970 ⚠️ As always, use a tight stop-loss...
#BONK has formed a descending triangle pattern on the 6H chart. This setup often suggests a potential breakout — typically to the downside, but fakeouts or bullish breaks can occur, especially in strong markets or during volume spikes. If the price can hold above the EMA50 and attract strong volume, a bullish breakout becomes more likely. In that case, the...
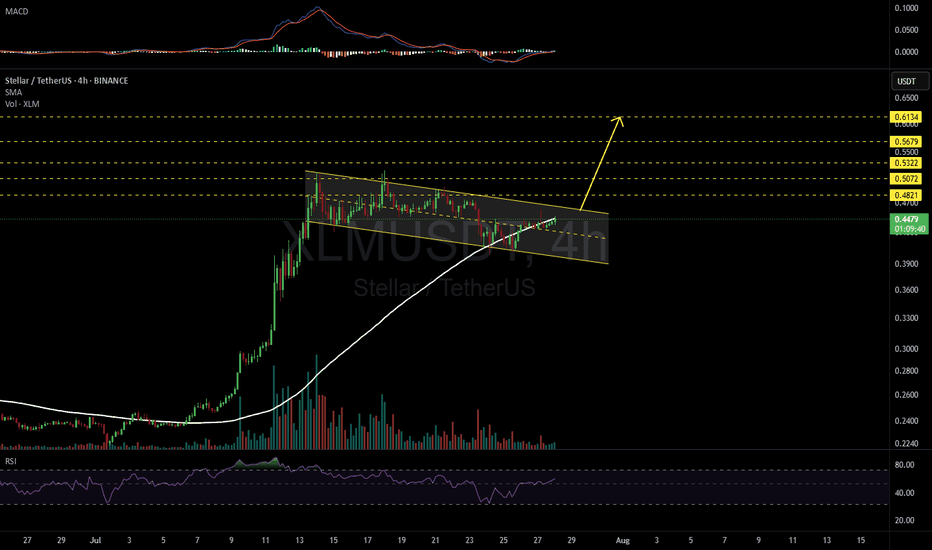
#XLM has formed a bullish flag on the 4H timeframe. In case of a breakout above the flag and the SMA100, the potential upside targets are: 🎯 $0.4821 🎯 $0.5072 🎯 $0.5322 🎯 $0.5679 🎯 $0.6134 ⚠️ As always, use a tight stop-loss and apply proper risk management.
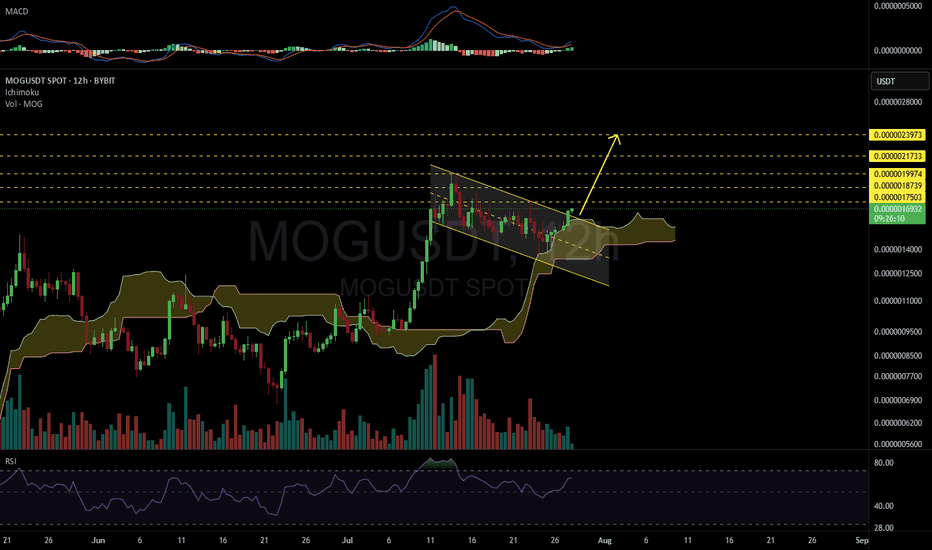
#MOG has broken above the bullish flag on the 12H timeframe. The Ichimoku Cloud is also providing solid support in this area. In case of a successful retest of the flag, the upside targets are: 🎯 $0.0000017503 🎯 $0.0000018739 🎯 $0.0000019974 🎯 $0.0000021733 🎯 $0.0000023973 ⚠️ As always, use a tight stop-loss and apply proper risk management.
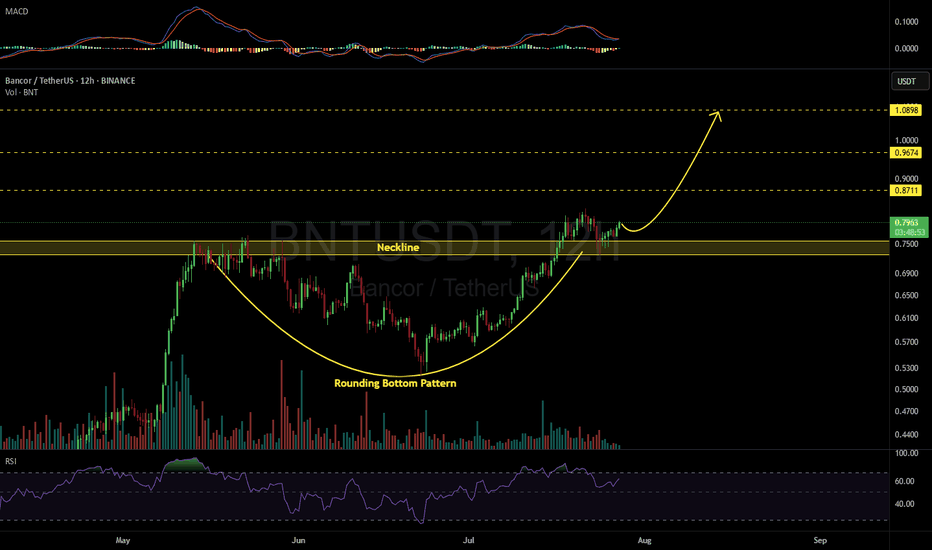
#BNT has broken above the neckline of the Rounding Bottom Pattern on the 12H timeframe, and the retest has been successfully completed. Here are the potential upside targets: 🎯 $0.8711 🎯 $0.9674 🎯 $1.0898 ⚠️ As always, use a tight stop-loss and apply proper risk management.
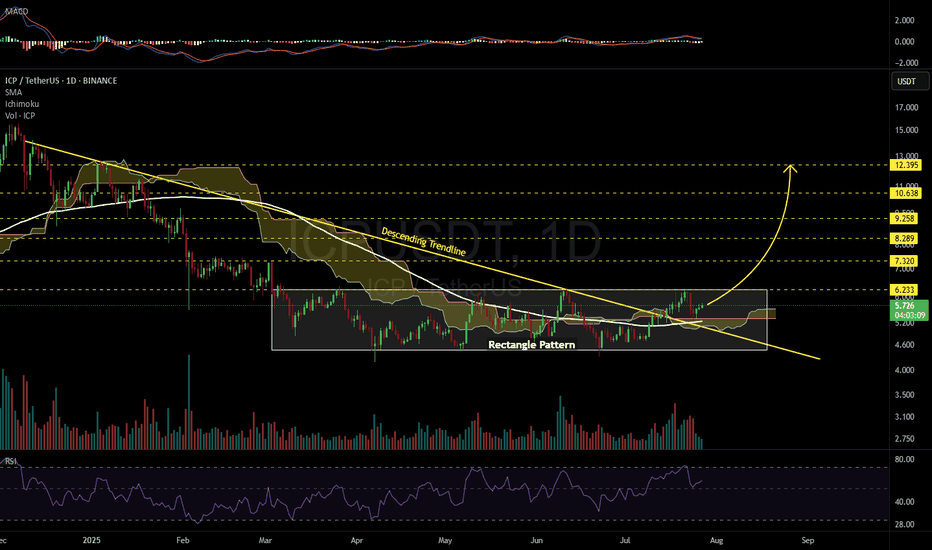
#ICP is moving inside a rectangle pattern and has already broken above the long-term descending trendline. It has completed a successful retest, and the price is now trading above both the daily SMA100 and the Ichimoku Cloud — a strong bullish signal. We expect a breakout above the rectangle soon. In case that happens, the targets are: 🎯 $6.233 🎯 $7.320 🎯...


