Bixley
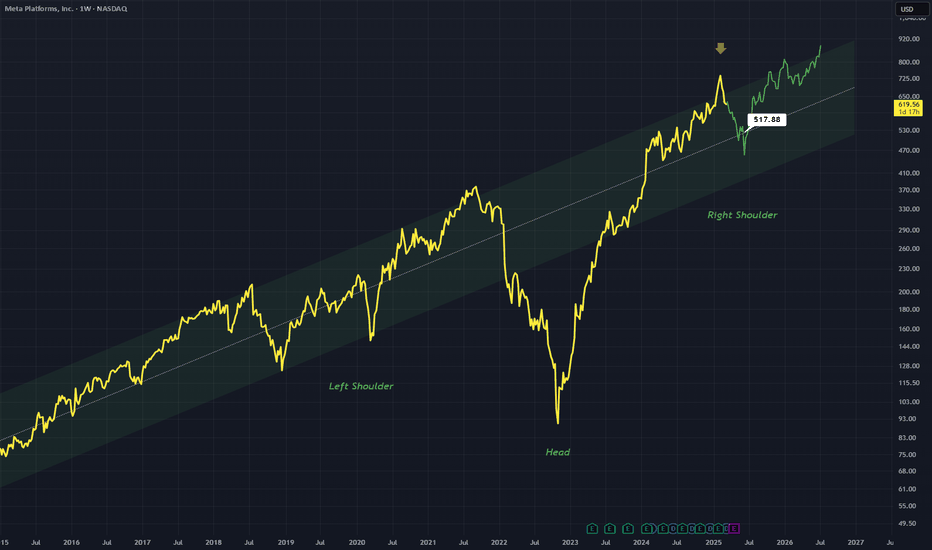
META is at the top of a dominant channel A kind of angled head and shoulder pattern can form if we assume a downward move on the right side Downward move to the middle of the channel which I have labelled with the price label Weekly timeframe
AAPL has been moving consistently up the green solid line, finding support over and over again Will this continue? (white circle) If not will we see a break down to a lower trend line (dotted line) This dotted trend line extends further back on the Monthly timeframe which I can't really show on this Weekly timeframe I am bearish
MSFT has formed a channel way above a dominant trend line This is coupled with a double top (higher high double top) suggesting after a pull back bulls will return I think there will be downward movement to test this trend line in green again Weekly timeframe
A Three downward move situation with the last dip being the largest pushing price down to a lower trend line in red (dotted line) Bars pattern tool in red shows my thoughts of the bearish movement I think price will continue down below the green line that has previously been seen as support Daily chart
The RSI on ETH.D shows a large channel with a strong bearish favor Currently RSI is in oversold area I expect on this Weekly chart RSI to reverse and possible one day even get out of this extremely bearish state Weekly
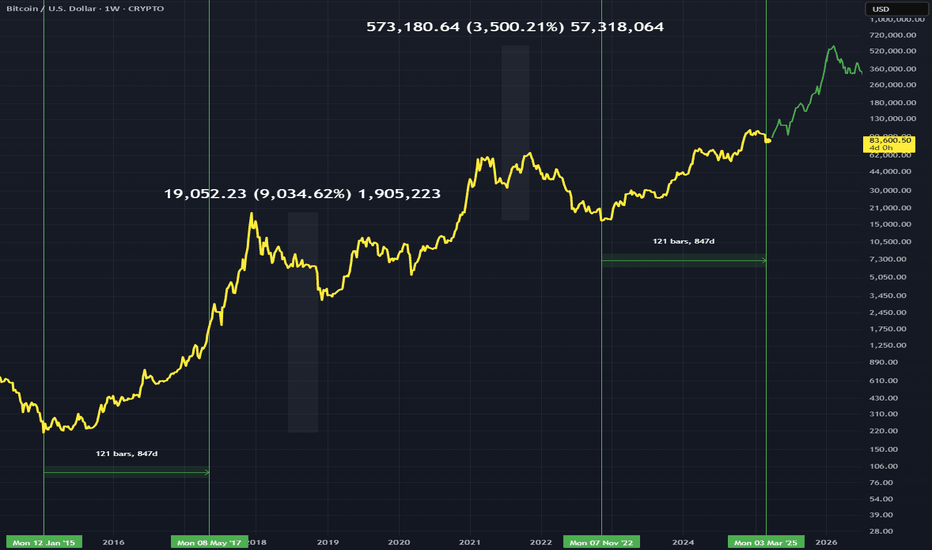
If we are experiencing a similar run to 2017 we would be 847days into the bull run I have shown the bars pattern for where price could go with the rest of the time left, which shows a 3500% gain this bull market. This is compared to the 2017 run which was a 9000% gain to the top. We have some bull time left is the take away if the runs are comparable. Weekly chart.
BGBUSD has seen some incredible up movement so i expect this curved up trend to break down which i have shown with the green bars tool. I have two support targets shown with the price label tool along the dashed red horizontals Daily timeframe
Drawing a massive triangle between the previous peak of SHIB From that peak price has mainly moved horizontally with not many breakouts Perhaps we will see movement out of this triangle like what was seen in the early bull run for SHIB Speculative idea Weekly timeframe
Trend Line in green is a good position for price to reverse in the bulls favor This aligns well with the 0.786 fib line As you can see it has broken down out of a small channel shown in the green dotted section Weekly timeframe
Ethereum is attempting to find a bottom before attempting its next leg of the bull run This touch is shown along the yellow dotted line which I have shown in the green circles Bulls will have there day when this line is tested This also aligns with the 0.618 fib Weekly timeframe
The middle of this indicator was previously seen as a strong support Right now this is being tested as support right now Will it act as support as before or break down further? Weekly timeframe for this indicator which is still in its bullish state
Litecoin has produced a beautiful Bullflag on the 12 Month chart Its honestly crazy how great this looks on a yearly timeframe If you want to go very very long this is a great option MASSIVE BULLFLAG
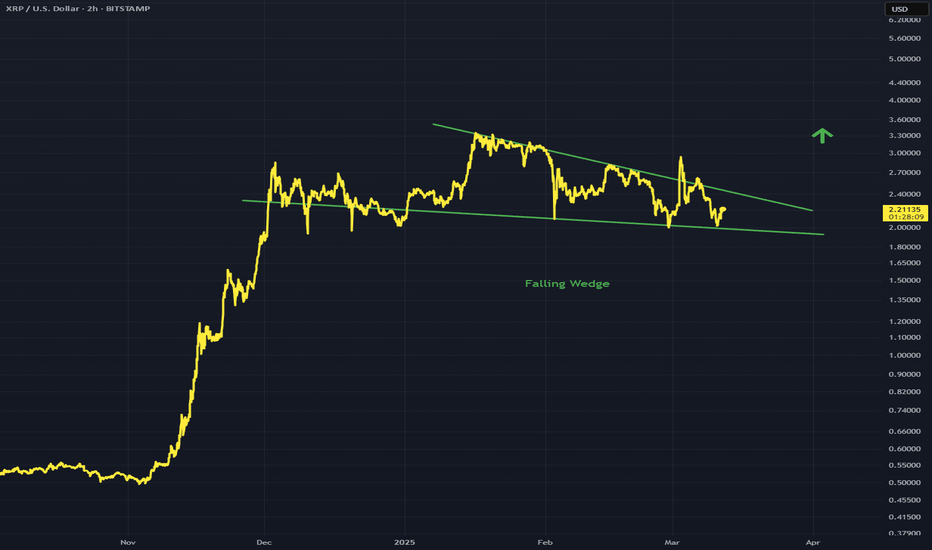
Price is currently in a falling wedge formation on this 2H timeframe This is a bullish pattern and can lead to some big moves I doubt the bull run is over for XRP as I have said is some previous analyses Chart pattern analysis
Current trend line is nearly being touched I think we will see a reversal from this current bear movement once this trend line is touched From there I think the price action up will accelerate Daily timeframe
After some short term bear movement I expect a strong bull move as we enter the final stage of this bull market I have shown this bull movement with the green bars pattern with an extension up to 1.272 Don't get shaken out as we are in a large green upward channel Daily timeframe
I think TSLA recent drop is due to overreaction to musk Chart shows a double bottom along a nice trend line I expect price to break out strongly as it has in the past and move above the channel that its currently in, just as it did in the lower channel Current thoughts using the bars pattern tool in green Weekly timeframe
XRPUSD has poised itself above this line that is now support Previously it was resistance in the last bull run A support here allows for further movement upward XRP is not done Very bullish daily chart
I think price will retest green circle, a point which was seen as a great support point leading to a strong bull move. This bull move may occur again on this second retest of the upward white line within this broadening structure still bullish it just may take another test of this downward movement Daily timeframe


