Bixley2
Big breakout for the altcoins on this chart It seems the bull market is starting, right now i think that XRP is the front of this race. Great buy right now on this weekly
an idea for the bulls showing a curved channel rising Once the bulls kick in price may push up to the top of this channel as it has before, putting price at around 2k SOLUSD is a good altcoin pick imo Weekly chart
ETHBTC has jumped up and has formed a short term bullflag Has ETHBTC bottomed? ETH ^^ Daily chart
A nice bullflag structure has presented itself on this daily timeframe I think this bullflag will allow ETH to catch up to BTC in term of alts vs BTC I expect a very strong bullish move to be coming in the next month or next month breaking out of this bullflag Green horizontal has been seen previously as a point of support.
Bitcoin is still above the ascending trend line in green however price is looking to form a next high reaching new ATH's This could lead to resistance at the next top creating a double top, pushing price back down to the ascending trend line. From there if this strong trend line in green breaks it could turn very bearish below that line. 4Hr chart
Looking for a third strong wave up within this expanding pattern as price hits support in white Moves up in green rectangles are similar Hourly timeframe with the horizontal dotted line as a strong support line
A bottom like this is great I suspect ETH will outperform BTC for awhile while altseason begins/continues A strange chart but a good one for a reversal Bars pattern shows my thoughts of a complete W reversal Monthly timeframe
Expecting BTC to slow down to allow alts to catch up to this massive run Once the bottom trend line is hit BTC will probably keep going Small Correction Weekly timeframe
ETH has reclaimed the 50MA this month and with a day until June i suspect the bull action will continue Monthly chart with the 50MA in yellow Keen to see where this goes
Great position for the bulls Weekly chart so its gonna be a long position Bullish bounce off the MA is expected and new ATH's for ETH and BTC will come Weekly timeframe
Looking at past price movement for ETH this area shows a strong upward movement which probably will repeat Very bullish time for altcoins especially after BTCUSD finishes its run Lets go
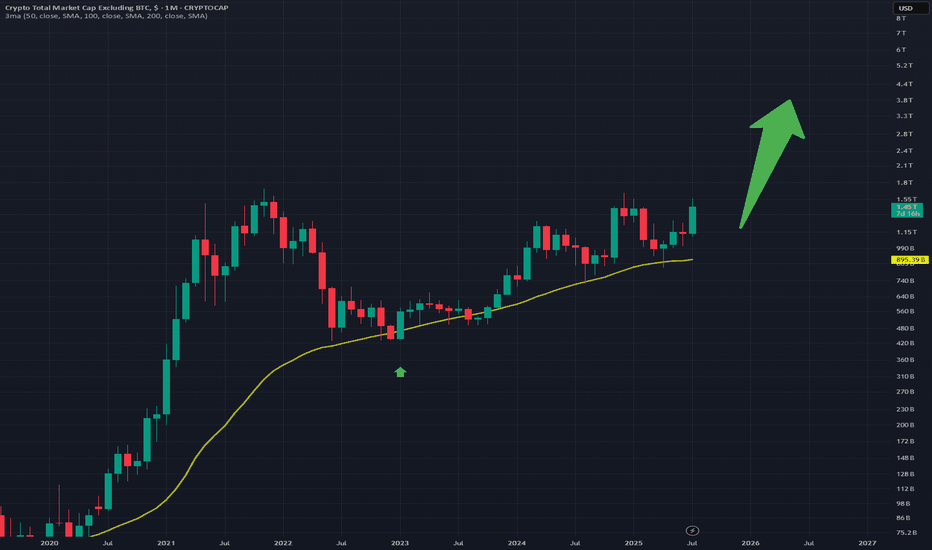
Monthly observation of the alt coin market cap chart Looks like the bulls are in for a treat Very bullish favor 50MA has held quite well Monthly chart
A major support line has been recovered on this ETH daily chart One that previously led to a strong breakout From here price will find support on this line and then pop off again Good time to buy ETHUSD Daily chart
As seen on chart price has recovered this line previously seen as resistance and is now using it as support This is extremely bullish for price as the resistance has essentially flipped to support Great time to buy crypto as new ATHs for Bitcoin are about to come Daily timeframe
A bullflag on the daily chart for BTCUSD suggesting price will move higher in which a bullflag is a bullish pattern indicated by the name I think Bitcoin will still move up but alts will outperform with this next move Daily chart
A chart for the altcoin market showing a rounded structure forming above the 200MA on this daily chart The 200MA will likely act as support and allow price to move higher Still bullish for alt coins
Listed a few bull targets once this breakout of the falling wedge pattern occurs Hopefully these levels are reached and the previous ATH is eclipsed Falling wedge is a bullish pattern, lets see where it goes Weekly chart
Expecting a move down to complete a larger inverted H&S This aligns well with a horizontal support line 1hr chart Short target in the green circle to the right at about 937


