Bixley2
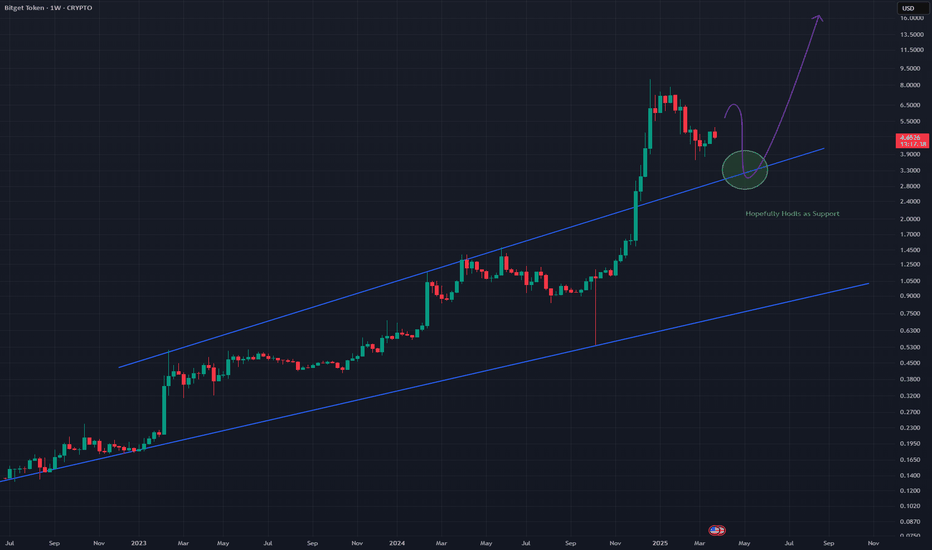
Up trend in blue that is currently being tested, i expect a strong bull move off this up trend line Using the dotted white line an ascending triangle can be plotted This is the daily chart for BNB
A falling wedge idea I think the down trend in white will be retested before the true breakout After that the falling wedge pattern can act on its bullishness Daily chart
Another Ascending triangle trying to find a bottom It will either bottom on the solid blue line or the dotted blue line, these are the most likely reversal points for the bulls From there price can breakout on this Daily timeframe Bullish
Another Falling Wedge structure Falling wedges break out to the bullish side which is on the Daily time frame on this chart Bottom dotted line is strong support and a great buy line
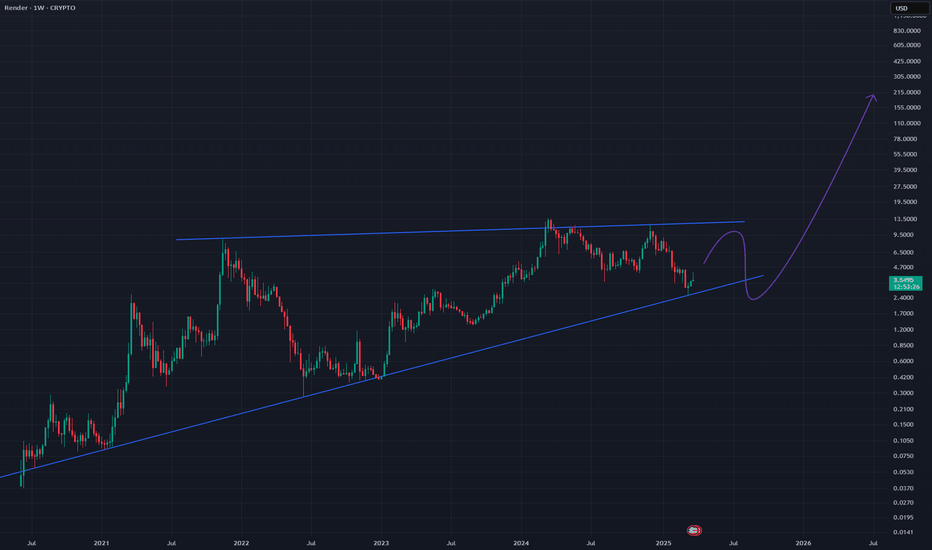
Falling wedge on this Weekly timeframe Likely will see a strong breakout leading to a new ATH Massive upside potential as falling wedges often provide
A nice bullish triangle structure this time ascending Great bull break out situation I sometimes can mistake ascending triangles for rising wedges but im pretty sure this is an ascending triangle They look similar! Weekly timeframe
An idea showing a large rounded bowl structure with all that's left to come is the bull run side of the bowl I expect AAVE to go above 1000+ this bull run as per the label Weekly timeframe for this one.
Symmetrical triangles are bullish patterns. Potential for big upward movement on a long timeframe, following breakout of this triangle Showing the triangle on the daily timeframe here.
XLM has made a strong move along with XRP and has perched itself on top of the Monthly Gaussian Channel I have posted the comparable move that occurred in 2017 which puts price above $40, I doubt it will perform as well as previously but its cool to see. Very bullish on this Monthly
An upper trend line from a lower point of this bull run has been broken above and will now likely be tested as support Hopefully this acts as support and the bull continues, if it breaks down below however a bear market could ensue. Great run from this coin. Weekly timeframe
Aptos is within this nice symmetrical triangle and is looking to break out This break out will be big pushing price into the double digits Great setup for an entry currently This is a new account I have made, still Bixley. Weekly timeframe


