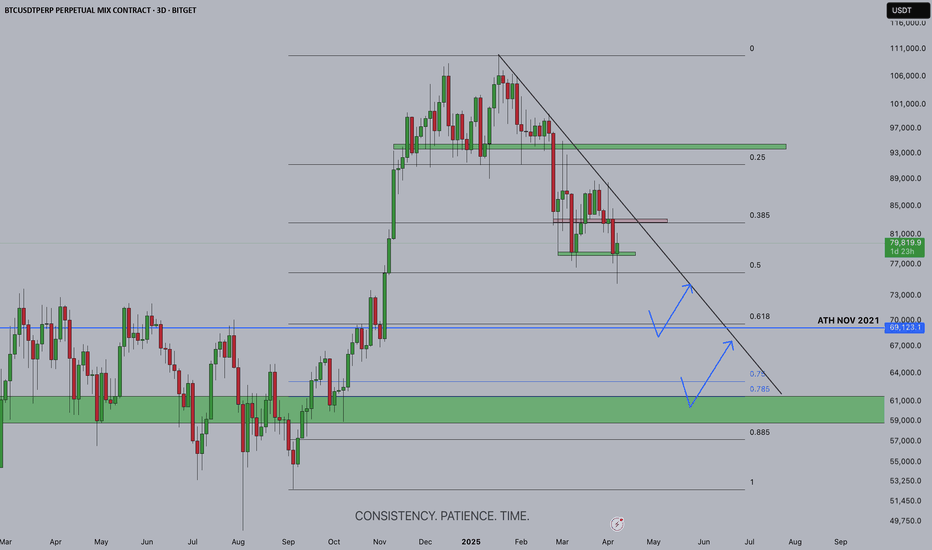
Bitcoin is currently trading around $79,200 on the 3-day chart and is sitting just above the key 0.5 Fibonacci retracement level from its most recent macro impulse. The chart shows a clear descending trendline acting as dynamic resistance, reinforcing the ongoing downward pressure on price. Until this trendline is broken and retested from above, market structure...
Following our recent examination of the American Dollar Index (DXY), the bullish momentum has continuously propelled the dollar, reaching peaks not observed since November 2022. It's worth noting the impressive streak of 11 consecutive weekly green candles. As we inch closer to a historically significant reaction zone, there's been a noticeable price rejection of...
📈 Analysis: After nearly a month of consolidation, SHIB seems ready to rejoin the cryptocurrency market action. Accumulation and Support: During this period, SHIB held strong support levels within the range of 0.00000710 to 0.00000705, clearly marked in the highlighted box. 🚀 Bullish Signals: On the daily chart, SHIB shows signs of breaking out of this...
The NAsdaq-100 (NAs100) index is currently displaying a classic double top formation on the weekly timeframe, signaling a potential bearish reversal following a robust 7-month rally. This surge was primarily propelled by a select group of companies utilizing AI technology. A Double Top pattern, characterized by two almost equal peaks, serves as a bearish reversal...
In the Ethereum (ETH) market, exciting movements could be on the horizon, offering potential scenarios that traders and investors should consider. Scenario 1: Break and Potential Rally If Ethereum breaks its current trend line and surpasses a resistance level, closing above it and confirming it as a new support, we might witness a rally toward the $2,000 levels....
In the world of cryptocurrency, Bitcoin (BTC) stands as a cornerstone, continuously captivating the attention of investors, traders, and enthusiasts alike. As we venture into the next few months, the Bitcoin market is marked by both excitement and uncertainty, presenting a myriad of possibilities for those willing to navigate the ever-shifting tides. Bitcoin's...
After successfully breaking out of the previous bullish bull flag, Bitcoin experienced a pump, reaching new weekly highs at $31,812. It was an eventful week with several significant developments: 1) US judge ruled that Ripple XRP is not a security, leading to a price increase of 103.16% for XRP. 2) US inflation fell to 3%, lower than expectations. 3) Europe is...
BTC has been very fun to scalp in this flag pattern over the last few weeks. But we are getting really close to a moment of make or break. I like to keep my technical analysis really simple, using basic techniques such as price action, trend-lines, and zones of support and resistance (S&R). As the analysis clearly illustrates, we can see a 50/50 scenario here. A...
The American Dollar Index (DXY) appears to be forming a double bottom pattern similar to the one it formed in March 2022. This pattern is considered a bullish chart pattern that indicates a potential trend reversal from a downtrend to an uptrend. A breakout from this pattern could trigger a significant rally in the dollar, possibly up to the 110 price...
I'm really curious on how this one will play out. Seems like the patterns are in correlation and we seems to be almost ready to head down to the next phase of Depression in the Psycology of a market cycle. If this is the scenarios, most likely the 25k level was our roof, and the next major support beneath the actual price now are 22k and 21k. We'll update soon...
Following the sequence of new and full moon we can see that the two actually match. Now for our last new moon, the price has dropped following our theory. I'm expecting BTC to continue further down somewhere around 33k to a double bottom, which lines up perfectly with the next full moon, and the beginning of the Mercury retrograde. I'm using the Mercury...
following the sequence of new a nd full moon we can see that the two actually match
waiting for the fib retracement in my golden ration to then bring this baby down to the next level
After the last short impulse, we have retraced pefectly between the 79-88% levels, and ready for it's next move. Also, to notice how it failed to break the trendline.
Using 2 indicators for moon phases in order to understand the correlation of the 2, as per every full moon we short and every new moon we long.
Waiting for further price movement to understand if there a retracement, or just a break and retest for the next impulse
We are heading into an all time low, followed by the trned based fib and S/R traced back from 2014. We will wait for further confirm on this move


