BluetonaFX
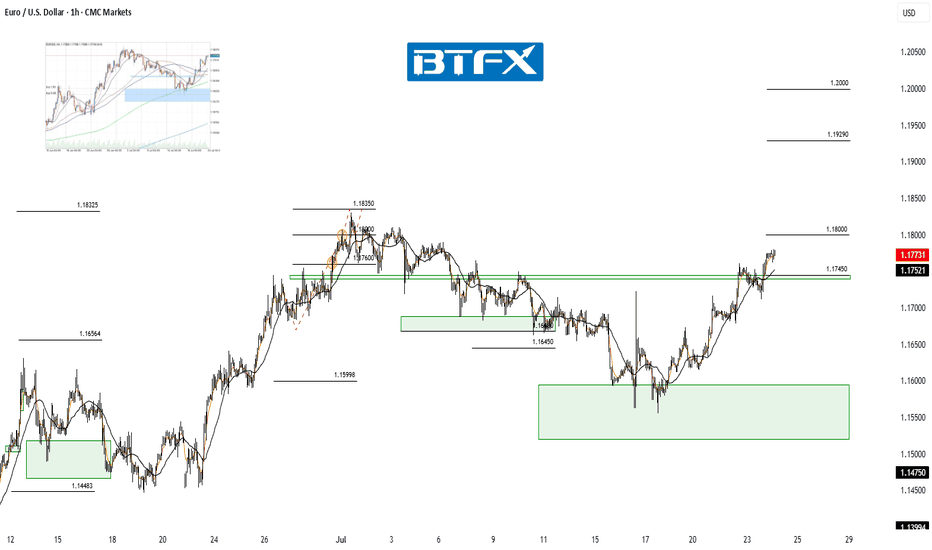
PremiumHi Everyone, Since our last update, EUR/USD briefly dipped below the 1.16000 level but quickly reclaimed the key 1.16450 zone — a level that continues to serve as an important structural pivot. Price has since stabilised above this support and is now moving back toward the highlighted resistance area around 1.17450. A sustained push toward 1.18000 in the coming...
Hi everyone, GBP/USD has bounced off structural support and continued to move higher, showing signs of renewed buying interest. This zone has previously acted as a strong support base, and the current reaction suggests there may be scope for further upside toward the previous consolidation levels above. A decisive break above 1.37500 would reinforce our bullish...
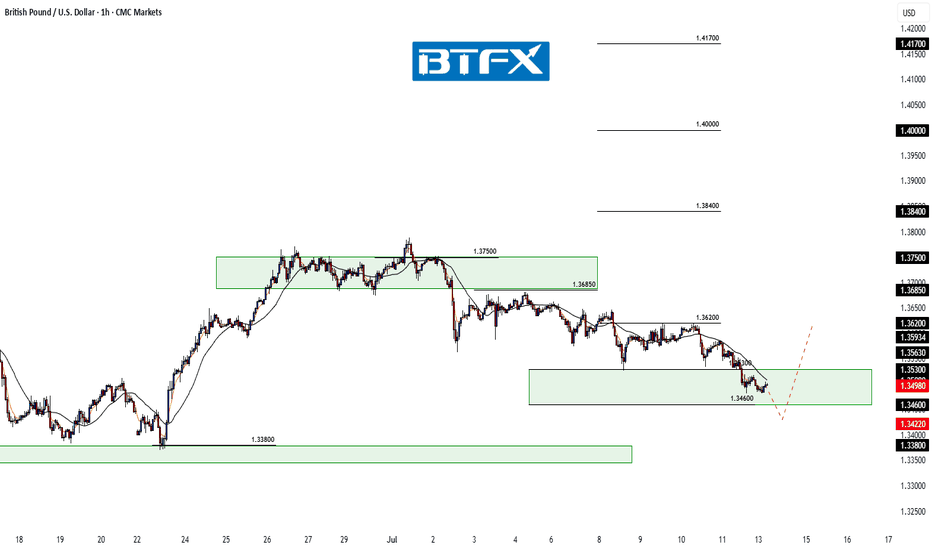
Hi everyone, Since last week, GBP/USD has continued to consolidate below the 1.36200 level, with several failed attempts to break higher reinforcing this area as firm resistance for now. Following the latest rejection, price moved lower into the 1.35300–1.34600 demand zone, where we’re watching closely for signs of renewed buying interest. This zone has...
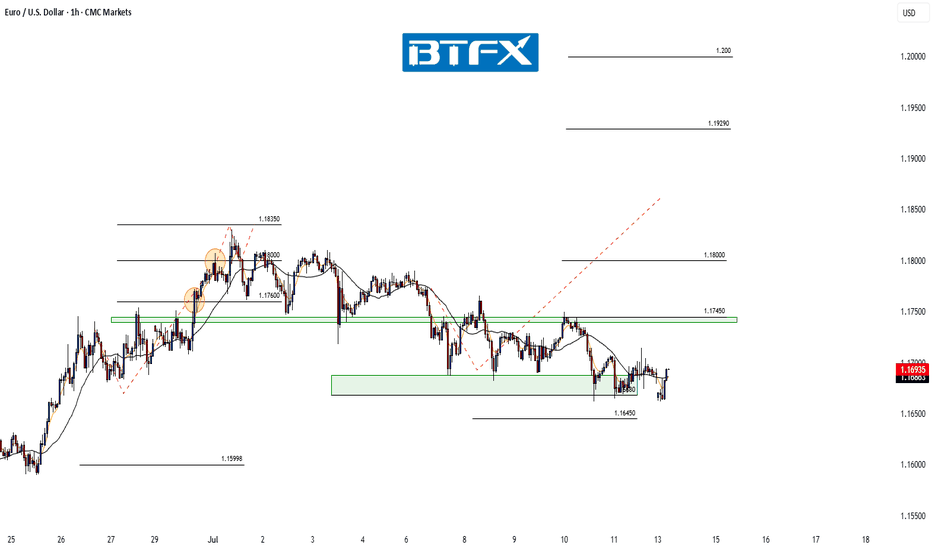
Hi Everyone, Since our last update, EUR/USD continues to range near the 1.16680 support level. We’re watching for buying interest to emerge above the key 1.16450 zone, which has acted as a critical level for the broader structure. Should price manage to stabilise and form a base here, there’s potential for a move back towards the highlighted resistance area...
Hi everyone, GBP/USD continues to consolidate below the 1.36200 level, with multiple failed attempts to break higher confirming this area as firm resistance for now. Following the rejection, price moved lower into the 1.35300–1.34600 demand zone, where we’re watching closely for signs of renewed buying interest. This area has previously acted as a support base,...
Hi Everyone, Since our last update, EUR/USD is currently testing the 1.16680 support level. We’re watching for buying interest to emerge above the key 1.16450 zone; if price can stabilise here, we could see a retest of the highlighted resistance area around 1.17450. Our broader outlook remains unchanged: as long as price holds above 1.16450, we continue to look...
It’s a topic that sparks plenty of debate. 👉 Can a negative risk/reward ratio actually be part of a winning strategy? Here’s our take, split between intraday trading and swing trading: 📉 Intraday Trading ☑️ Pros: • Can work in high‑probability setups (mean‑reversion, range scalps) • Quick targets often get hit before stops • Stops can sit beyond liquidity grabs...
Hi Everyone, Price briefly dipped below the 1.16680 support, but our broader outlook remains unchanged as long as it continues to hold above the key 1.16450 level. Should buyers successfully defend the 1.16450 zone, we still see potential for the pair to stabilise and make another attempt higher in the coming sessions. We’ll be monitoring price action closely to...
Hi everyone, GBP/USD continues to consolidate below the 1.36850 level. Price failed to break above and moved lower into the 1.35300–1.34600 zone, providing us with a clean intraday trade setup. A drop into this area was highlighted as the more probable short‑term path, and we’re now looking for GBP/USD to find support in this region; and more importantly, to...
Hi everyone, GBP/USD continues to consolidate below the 1.36850 level. We expect a retest of this level today; should price fail to break above, we anticipate a move lower to find buying interest between the 1.35300 and 1.34600 zones. A drop into this area appears to be the more probable short‑term path and could set the stage for another push higher. As...
Hi Everyone, Monday played out as expected; a bounce off the highlighted support area appears to have provided enough momentum for a retest of the 1.18000 level. Price could briefly dip below the 1.16680 support; however, our outlook will remain unchanged as long as we hold above the 1.16450 level. We maintain the view that a decisive break above last week’s...
You’ve all heard it, “Cut your losses and let your winners run.” Simple words — but living by them is what separates survivors from blown accounts. Here’s some tips on how to approach risk management when trading: ☑️ Risk is always predefined: Before I click Buy or Sell, I know exactly how much I’m willing to lose. If you don’t define risk upfront, the market...
Hi everyone, GBP/USD failed to break above the 1.37500 level and saw a rejection from that resistance, dropping further below the 1.36850 support. Since then, price has consolidated and ranged beneath this level. Looking ahead, if price remains within this range, we anticipate a move lower to find buying interest between the 1.35300 and 1.34600 levels, which...
Hi Everyone, Last week, price action delivered the 1.18000 level we had been calling for, and as expected, dynamic resistance around that area proved to be significant. Looking ahead, we anticipate EUR/USD will continue to test the 1.18000 level this week while holding above the 1.16680 support zone. A strong break above last week’s high could attract further...
Hi Everyone, We anticipated a retest of the 1.17400 level coming into this week, setting the stage for further upside toward our highlighted targets at 1.17600 and 1.18000. Monday delivered, with a sharp move higher that saw EUR/USD break cleanly above 1.17400 and extend to 1.17600, bringing the 1.18000 level into focus. As previously noted, we expect dynamic...
Hi Everyone, As highlighted, a successful bounce from the near-term support at 1.16680 provided a retest of the 1.17400 zone. Looking ahead, we expect price action to revisit this level in the coming week. A confirmed break above this resistance could open the path toward 1.18000, where we anticipate encountering dynamic resistance. As outlined in our analysis...
Hi everyone, A strong push up from our highlighted support level at 1.33800 toward 1.36850 saw GBP/USD enter a brief period of consolidation. During the week, price action ranged between this newly established support and the 1.37500 resistance level. Looking ahead, we anticipate a decisive break above 1.37500, which could open the way for further upside. As...
Hi everyone, Price achieved the 1.36850 having found support near the 1.33800 level. As previously noted, the clearance of these levels strengthens our expectation for further upside, with the next key level of interest around 1.38400. We'll be watching to see how price action develops from here. We’ll continue to provide updates on the projected path for...


