BootlegTrader
PremiumMonthly Divergence (White Trend Line) Daily Divergence (Black Trend Line) Daily Wedge Pattern Fresh ATH No more positive news in this market - Once stimulus bill receives approval, market will move up towards 31,000-31,500 and will proceed to fall. No more vaccine news can save this market other than a 100% success rate which is close to impossible. 28,000 -...
4H trendline Gartley Pattern completion 24500 Psychological Level
Love this trade for the RR. The SL I currently have may be extended throughout the week.
Massive Trend line on the weekly time frame Break of a trend line on the Daily 50$/Barrel is a very strong support. MACD divergence on the daily is also a good sign. Market sentiment is extremely short right now, if I'm big money I am looking for some profit taking. Oil is attractive as Chinese economy will slowly come back online and airlines will also start...
Description provided in the idea - trade at your own risk
A break of the red trend line and we're off to the races. buy low, SELL HIGH
Very simple trade with technical setting up at all time high. I am already in this trade but you can enter on the break of the red H4 trendline. The black trendlines are daily and the red zone is the previous all time high. buy low, sell high. Best of luck and make sure to trade with proper risk management.
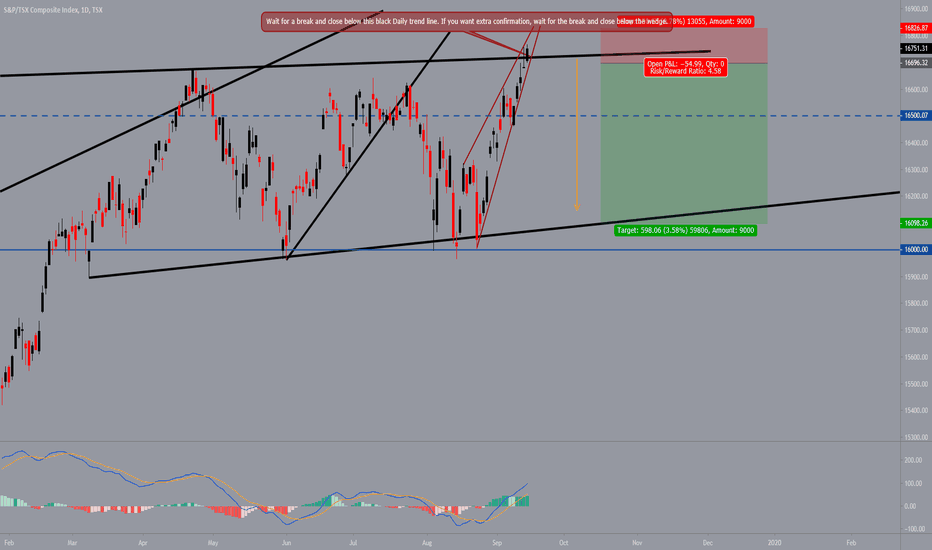
Follow the instructions as mentioned in the text box. Once the price closes below the black trendline, put your stop loss a few points above the highest point and let your target be the bottom of the channel. This should provide you a very nice risk reward trade.
Technical Analysis: Price bouncing off two black daily trendlines. It is also bouncing off a H4 bottom trend line (Red) MACD Divergence on H4. Fundamental Analysis: While the pound isn't the strongest currency atm, AUD is even weaker currently. Conclusion: Nice little setup for 100 pips minimum. Trade at your own risk. Flipside idea: If price bounces off...
Fundamental Reasons: Increasing tensions with Iran Bottlenecking of production in Permian basin - Lower supply Technical Reasons: Break of Daily TL. Fibonacci retracement. Buy now and put SL under 54.50 and let the trade ride. Trade at your own risk.
US30 Short Technical: Two Daily trendlines crossing each other. 4 hour Trendline (Red) - adding confluence to daily trendlines MACD Divergence on both daily and 4H timeframes. Enter now with smaller lots or on break of red trendline. Fundamentals: Political Uncertainty Increasing tensions internationally 0.25 Fed cut already priced in for July 31st, market...
Third touch of Daily TL, no real fundamental news drops this week that would affect either currency. High probability technical setup because of the timeframe.


