If you think this move in the markets is enough to rattle your nerves, imagine what a move lower in OIL would do to the markets? OIL has extended nearly 100% beyond recent price rotation and has setup a nearly perfect rotational top pattern. If is my opinion that OIL will likely rotate lower towards $60 in the immediate future while the US majors rotate through...
Looking at this chart and listening to many of the BitBulls, the standard reply is "of course it is volatile and normal rotation is 20~30% or so". I'm not so sure I agree with this at this point. This move lower is MASSIVE and I believe we could see sun $10k levels within 24~48 hours on a breakdown move. For those of you that have the guts to try to buy the dip...
As Bitcoin is struggling to find support, it appears the EURUSD is poised to break DOWN rather hard after a fairly strong run up. As long as price stays within these channels, it should likely continue higher. Yet, the current pennant formation/flag is setting up for a breakout/breakdown move. Notice the Tesla Vibrational ARCS that I use to help time the...
Unless you have a really solid belief that Bitcoin is the future, this chart is showing me that $13,500 must hold as the current support - otherwise we are going to see a very dramatic and fast decline to SUB $10k levels by the end of Christmas Day. At sub $10 levels, Bitcoin will have HALVED it's previous values and I expect many bitcoin believers may be...
Although I can't accurately predict the future, I will offer this analysis. Currently, the support channel is under pressure of being breached. This is a critical level and we need to watch this move because it could prompt a trend reversal. Additionally, any deep retracement followed by a move higher (back into the channel) could be viewed positively for the...
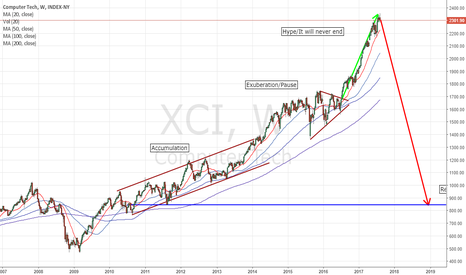
What makes 2012~2017 different from 1995~2000? Can you tell me what key factors will prevent a repeat DOT COM (technology) crash? In 1995~1999, the US was the single biggest and most advanced player in the technology field. Investment poured into these US tech firms as it was the only game on the planet. In 2012~2017, the US was the single biggest and most...
Pay attention folks. The NASDAQ and the global markets are setting up for a repeat of the DOT COM bubble burst. In the late 1990s, the DOT COM rise was attributed to a number of factors, most importantly the unique situation where the US was leading the global in technology advancements and web services. Investment in these firms was focused on hope and dreams...
Are you ready for the metals rally of your lifetime? My analysis shows we are about to start WAVE 3 and it should be a massive run higher. Get into position to take advantage of this and the associated global market weakness that may coincide with this move. My analysis shows that near Sept 1~11, we should be expecting to see a massive VIX SPIKE. This type of...
Be prepared for global uncertainty to drive the NQ towards recent lows setting up a Head-n-Shoulders formation that may be an ultimate top in the markets. Everything appears to be setting up rather well, divergence in technical indicators, North Korea tension, Earnings variations. We could be in for a 300pt+ drop in the NQ ending near Sept 11th by my...
My analysis of GOLD using Fibonacci, Gann and Tesla theories shows GOLD held at a critical Fibonacci level and is setting up for a 25%++ run to near $1400 by July 4th~14th, 2017. In reality, the move could be much higher given the range of Wave 1 - with an overall objective near 1674.
Be prepared for further decline in the US markets over the next few weeks. This custom index is still showing ability for price decline. Once the breakout happens, it will be quick and volatile.
Silver, in particular, is the metal to watch. Moving sometimes 3x the gold move is, ideally, going to surpass the $26 per oz range withing the next few months. I use a concept I call Fibonacci Time/Price inflection points - based on the teachings of Gann, Fibonacci and Tesla. The theory is based on vibrational channels that can be determined as key levels of...
This, a custom index I created to track the US market from various angles is currently flashing a very strong warning of extreme downward potential if price breaches 475. Ultimate downward price channels say 400 could be the ultimat support. If you bought into this new recent "highest high" BS, I urge you to protect your risk (longs) and watch for continued...


