Just posting for the community. If you don't have a chart to glance at the market quickly, use this one! Tweak it to make it your own.
6 chart meme overview on the 1hr with support and resistance $GME, $AMC, $KOSS, $BB, $NAKD, $EXPR
$M 1hr with support and resistance RSI needs a breather Will look to scalp puts, possibly even swing overnight. No position as of now
$ETSY 1hr with support and resistance/RSI Watching the 200.90 level for possible entry again - played yesterday
$EXPR 1hr with support and resistance/RSI No open positions as of now - have been scalping calls the last day and will look to do the same today.
$SPRT 1hr with support and resistance No position - following volume and waiting for the $14 break
Bidding on calls for Sept now. Respecting these levels. Looking for a good earnings report also.
$JPM into a smaller area of resistance. Interesting to see how it responds tomorrow morning.
MSFT - Daily with fib retracement and extension. No position.
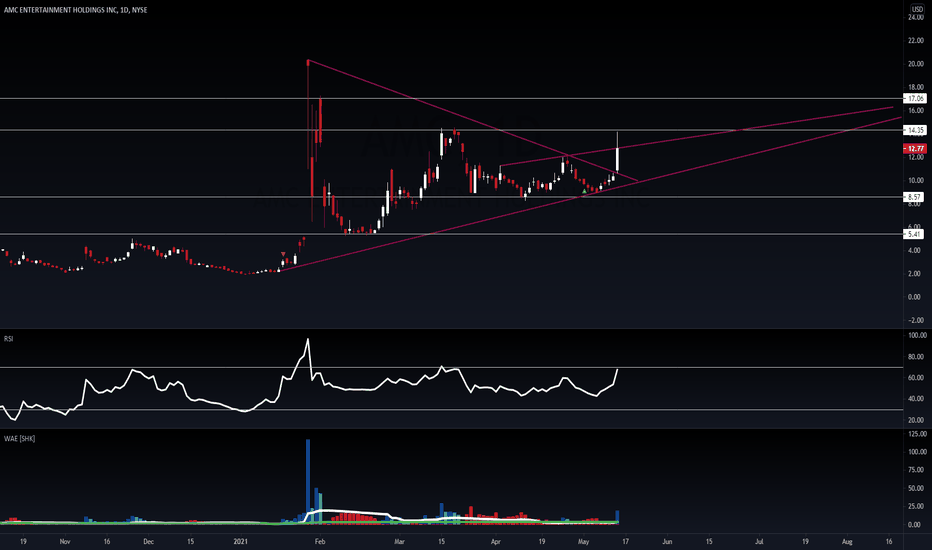
AMC 1HR - Trend and Fibs I dont have a position. I am not entering a new position right now. I made a ton of money on AMC. This chart is simply being posted so you can view the trends and make your own observations. Don't attack me meme lovers. Again I am not giving any feedback. It is almost impossible now to post a chart on Tradingview and not get...
On the verge. No position, haven't played it since the original run. Have no intentions of playing it. But today was a VERY important day from a chart perspective. Still needs gas.
ROKU - Daily with trendline and chart analysis
Not much to say about this. Prime example of what happens when top resistance breaks. NO POSITION.
Tomorrow will be very interesting. Looking to hold support. If not, watch out below. Holding PUTS.
LONG on DKNG. Have been for a long time now. No pun intended. We aren't settled yet. We have news coming with more states legalizing online gambling. They have a great partnership with the PGA tour. Plenty of catalysts to send this. We just aren't quite ready yet.
See this in the $48-$49 range real fast.
MSFT - Daily with Trendlines, RSI, Volume We are in a bullish trend with room to run. Bottom support is solid, perhaps a bounce and a retest back to the 263.12 area
Possible HOLD now. Unusual options activity today. Needs to clear that top trendline and get some volume behind it.


