NEE has a perfect bullish trend line happening. RSI not falling below 50 on uptrend & stochastic never becoming oversold on pullbacks. I would wait for the price to get near the trend line again for entry.
SPX breaking out to all-time highs this morning & Roku is following as it breaks out after bouncing off gap support. We will have to see if it can hold the breakout. The price targets are at $149.80, then $180.90 which are 61.8% & 100% Fibonacci Extension levels.
The SPDR Innovative Technology ETF has recently broken out of a bullish edge pattern. It also displayed bullish RSI divergence from the price action going back to August. My price target for this ETF is around $117 which is just below the 2.61 Fibonacci Extension level. The largest holdings of this ETF include ROKU, SNAP, SHOP, TER, & LRCX. Happy hunting.
An update from my previous INTC post on October 24th. The price has continued moving higher since the positive earnings announcement but the price seems to have been rejected right at gap resistance. Just have to wait and see where the stock can find support. I'm looking around $54.80 which is the 100% Fibonacci Extension level.
The weekly Paper Index has broken out of a bullish wedge formation while displaying a bullish divergence between price & the RSI indicator. Relative strength is beginning to develop against the SPX as well. This may be a good industry to scout for some alpha.
DRG broke out of a consolidation period during yesterday's trading & continued its bullish momentum today. The industry is also beginning to find relative strength against the SPX. This could be an industry worth looking around in to find some stocks to provide alpha if it continues to strengthen.
Since its IPO, WORK has not done very much for its investors. As the chart shows, it has basically been a descending channel that has been unbroken up to this point in time. The recent price movement, however, has created a bullish divergence with the RSI indicator while the price is moving out of an oversold condition. This combination may allow the price to...
The stock has created a symmetrical triangle pattern since the beginning of June. Also mixed into this pattern is an earnings gap halfway through the month. The price has continued to trade within this gap range but the consolidation has led to the stock price moving out of the triangle pattern. The recent pullback, while remaining in the gap zone, is now testing...
GRUB was already in a descending triangle pattern. The stock did have a bullish RSI divergence at the beginning of October which did lead to prices rises somewhat to re-test the resistance line of the triangle pattern. The price completely broke down after an ugly earnings report that was not taken well by the market prior to the market open. The breakdown price...
The stock had created a descending triangle pattern but with the strength of their earnings report, it broke out of the pattern. We will have to see how it settles over the next couple of days to figure out where it is going from here.
The $103.90 price range has been a good support line for the stock since February. The price broke down in May before regaining the line with the June rally. The descending triangle pattern has been in place since mid-July. Another breakdown of the support line would trigger the pattern with a price target of around $82.
The stock price broke down from its consolidation in September which dated back to early June. The price has recently bounced off a similar low creating a double-bottom pattern. While this double-bottom was created a bullish divergence formed between the price & RSI indicator. I would expect the price to continue rising & to eventually test the breakdown level...
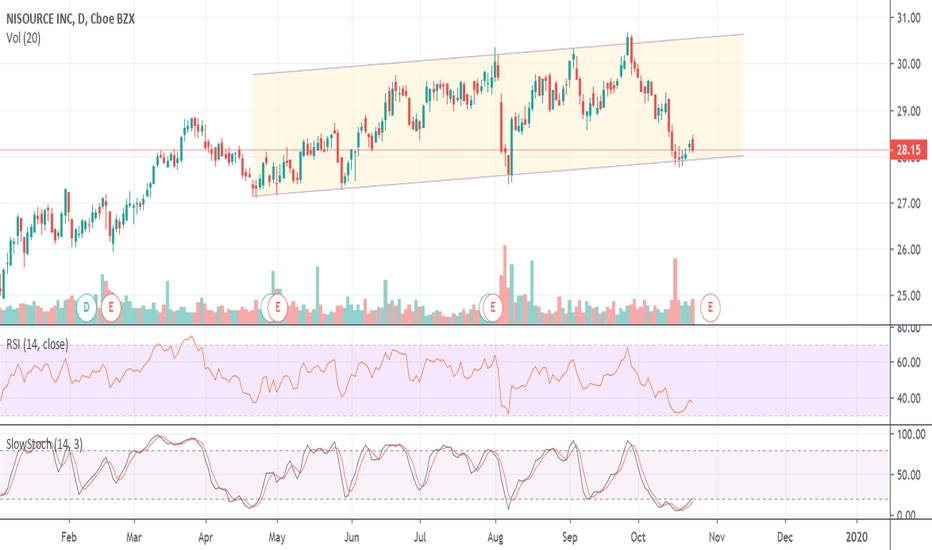
NI is a stock in the utility sector which has been one of the strongest sectors of the year. The stock has been following a slightly bullish channel since mid-April & seems to be bouncing off support again. Just keep trading the channel until it escapes higher or lower.
The primary pattern is definitely bullish going back to the December lows. Since the selloff in May, each pullback in the SMH does not reach the support trendline. Unfortunately, prices have created a new high creating a bearish divergence with the RSI indicator. The dashed purple line shows an intermediate trendline since the price has found strength on the...
MSFT has basically been consolidating within the same range since the beginning of August. The stock is in a neutral state at the moment, just waiting for either a breakout or a breakdown. You either have to sit on your hands or you can take the short-term trades as it bounces from resistance to support. Important to note that if you believe the market might pull...
As you can see in the chart, SPY has once again run into resistance at the $302 price range. The slow stochastic is overbought & seems to be turning over. There is also a bearish divergence forming between the price & RSI indicator. A 61.8% Fibonacci extension target gives us a price target that is near the current support line. It looks like a good time to take a...
TLT has fallen back down near support. This area is also an intersection of the triangle support line & the horizontal level, formerly resistance but now acting as support.
Bullish Ascending Price Channel had formed from December 2018 until it finally broke out in early September. The price consolidated for a bit before rising further. I am expecting a pullback that could retest the previous resistance line of the price channel around the $50 level.


