Nike's recent performance and technical indicators suggest a bullish trend. 1️⃣ Recent Earnings Report In its fiscal third quarter, Nike reported: - Revenue: $11.3 billion, a 9% decrease year-over-year but exceeding analyst expectations of $11.02 billion. - Net Income: $800 million, down 32% from the previous year. - Earnings Per Share (EPS): 54 cents,...
🔹 Analyst Expectations: - Low Target: $75.00 (current price) - Average Target: $91.64 - High Target: $115.00 🔹 Fundamental View: - Zoom posted stronger-than-expected earnings, but the stock pulled back due to cautious revenue guidance. - Financial health remains solid, and long-term demand for remote communication tools is stable. - Analysts see potential...
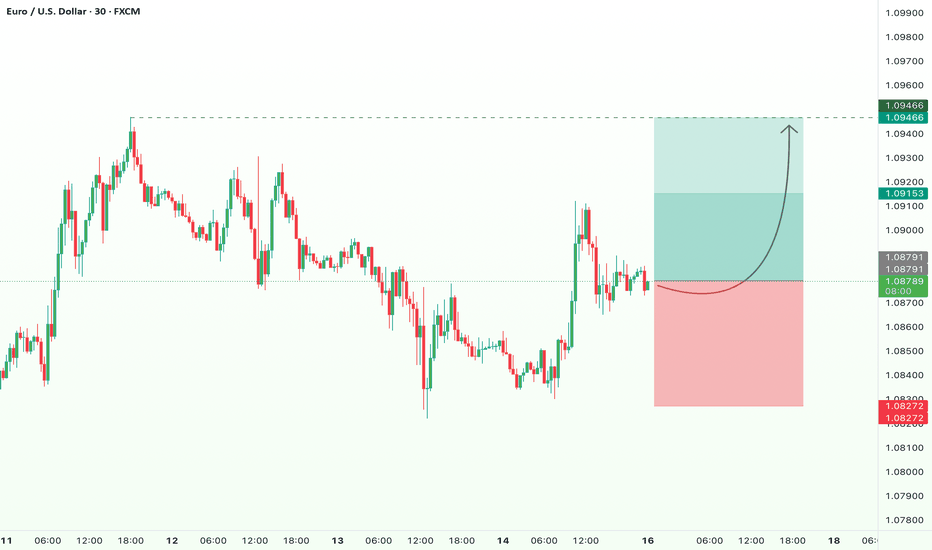
Spotted a potential short-term buy opportunity on EUR/USD! Price is showing signs of strength, and if momentum continues, we could see a push toward 1.0946. 🔹 Entry: Around 1.0880 🔹 Target: 1.0915 | 1.0946 🎯 🔹 Stop-loss: Below 1.0830 🚨 This setup aligns with current price action and market sentiment—let’s see if buyers step in! 🔥
TP1: €150 – Short-term breakout TP2: €180 – Mid-term resistance TP3: €250 – Long-term revaluation target Why Are We Bullish? 🔹 Defense Sector Entry? -VW exploring military production, with CEO Oliver Blume confirming interest. -Idle plants may be repurposed, potential Rheinmetall partnership in the works. -Rearmament boom – Rheinmetall’s valuation already...
📈 GBP/NZD Bullish Setup 📈 The British Pound is showing strong momentum against the New Zealand Dollar, with a clear uptrend structure on the 4H chart. Key Factors Supporting the Bullish Outlook: 1️⃣ Trend Continuation: The market remains in an uptrend, forming higher highs and higher lows—a sign of strong bullish momentum. 2️⃣ Break & Retest: After a...
The falling wedge pattern on the EUR/USD 12-hour chart has been confirmed, signaling a potential bullish breakout. This classic technical setup indicates a reversal from the prior downtrend, with buyers stepping in as price breaks above the upper resistance line of the wedge. Key Details: Pattern Confirmation: The breakout above the wedge resistance line...
🔽 EUR/AUD Sell Opportunity 🔽 ✅ TP1: 1.69817 ✅ TP2: 1.69388 ✅ TP3: 1.68876 🔹Stop Loss : 1.71128 🔒 Manage your risk wisely—stick to your plan and stay disciplined.
Palantir has dropped ~31% in 9 days due to market volatility and defense spending concerns. However, strong fundamentals suggest a bullish rebound. ❓Why Palantir Can Rebound ✅ AI Leadership – Palantir’s platforms (Gotham, Foundry, Apollo) dominate AI-driven data analytics. The AI Platform (AIP) enhances adoption. ✅ Strong Financials – Revenue surged from $742.6M...
Realty Income is a real estate investment trust (REIT) known for its monthly dividends and a strong portfolio of commercial properties. The company leases to well-established businesses across different sectors, making it a popular choice for income-focused investors. With earnings coming up this week, we are watching for potential price movement based on the...
🔹 Entry Zone: Around 18.307 🔹 Take Profit 1: 18.354 🔹 Take Profit 2: 18.390 🔹 Take Profit 3: 18.439 🔹 Stop Loss: Below 18.266 Analysis: USD/ZAR is currently sitting at a strong support level, where price has previously bounced multiple times. This area has shown buying interest, indicating a potential reversal. 🔹 The RSI is oversold, suggesting possible...
🔽 USD/JPY Selling Opportunity 🔽 📌 Take Profit 1: 148.96 📌 Take Profit 2: 148.38 📌 Stop Loss: Above 150.35 💡Reasoning: The USD/JPY pair has recently shown signs of weakness, with a potential reversal forming after hitting resistance around the 150.35 area. With key technical indicators suggesting a bearish momentum, we are anticipating a move down towards the...
💡 Reasons for a bullish movement based on technical view: The price is currently testing a strong $20–$21 support zone, an area that has previously led to significant bounces, indicating strong buyer interest. A break above $23 could signal an early bullish reversal, while a move above $27 would provide further confirmation of an uptrend. Additionally, the RSI is...
Crude oil is showing signs of potential downside movement. After a recent rally, price is facing strong resistance near $71.60-$72.65, where sellers are stepping in. 🔻 Key Observations: 1️⃣ Price previously broke out of a descending channel but failed to gain strong bullish momentum. 2️⃣ A lower high is forming, indicating that buyers are losing control. 3️⃣...
NVIDIA Bullish Setup! 💚 NVIDIA remains in a strong uptrend, respecting its trendline support and showing bullish momentum leading into its earnings report on Feb 26. With buyers stepping in at key levels, a push towards the $150 target looks likely in the short term! 🔹 Current Price: $137 💡 Why bullish? 🔹 Strong long-term uptrend 📈 🔹 Buyers defending higher...
EUR/USD is testing a key resistance zone, with a potential bullish breakout on the horizon. The price is retesting the level, and if it confirms as support, we could see strong upside momentum! ✅ TP1: 1.0577 ✅ TP2: 1.0651 ✅ TP3: 1.0729 🔻 SL: Below 1.0426 💡 Why bullish? 🔹 Price breaking key structure = trend shift 🔹 Clean risk-reward setup 🔹 Buyers stepping...
Super Micro Computer (SMCI) is showing strong bullish momentum, with the $30 support level holding firm since November. A recent breakout from the downward trendline and a rising channel on the chart signal steady upward movement, with potential targets at $36, $42, and $46. On the fundamental side, SMCI’s upcoming AI server releases are expected to drive...
The price is approaching a strong support zone at $145–$150, which has acted as a key resistance in 2020 and a reliable support level during 2022–2023. This zone could trigger a bounce, but much will depend on the upcoming earnings report on February 4th. A positive report might drive a rebound toward $160 or higher, while disappointing results could lead to a...
Hi traders, USDCAD is showing a classic bullish flag pattern, signaling that the uptrend is likely to continue! After a strong rally (the flagpole), the pair has entered a consolidation phase, forming a tight range between support and resistance. This setup is primed for a breakout to the upside. 💡 Key Levels: TP1: 1.44960 TP2: 1.45706 TP3: 1.46614 Stop Loss:...


