Chartstory_Jigar
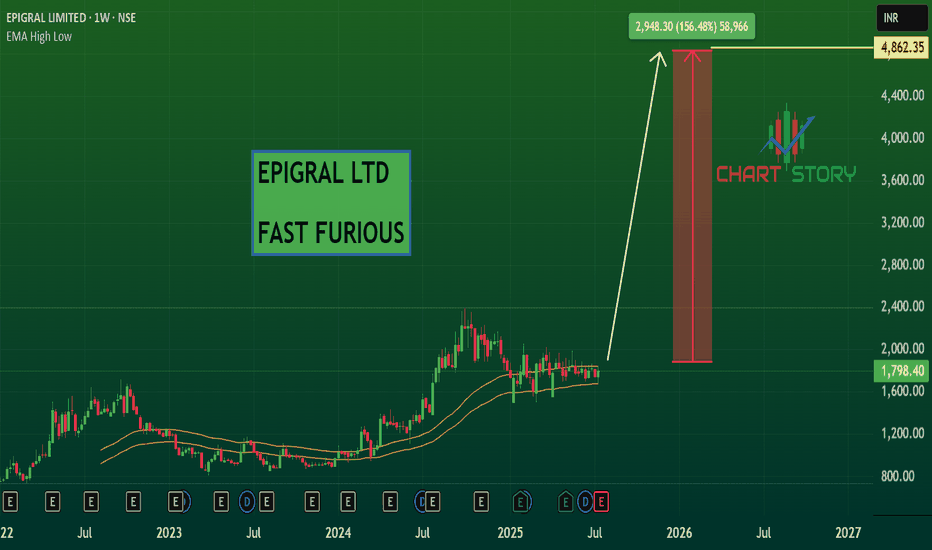
PremiumNSE:EPIGRAL Weekly parabolic location with accumulation for more confirmation one more buyers candle needed.
NSE:WONDERLA Weekly bottom fishing location with accumulation .
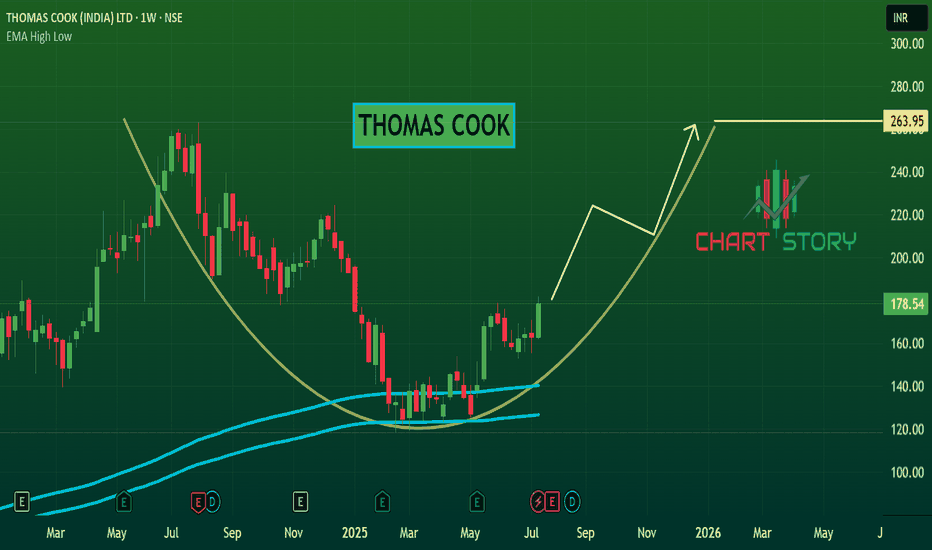
NSE:THOMASCOOK Weekly rounding bottom with momentum and macd crossover may continue upward with same momentum.
NSE:ITDC Weekly bottom fishing price action with accumulation.
NSE:VIMTALABS Weekly parabolic buy with buyers at location, super momentum can build for next 4 to 6 months.
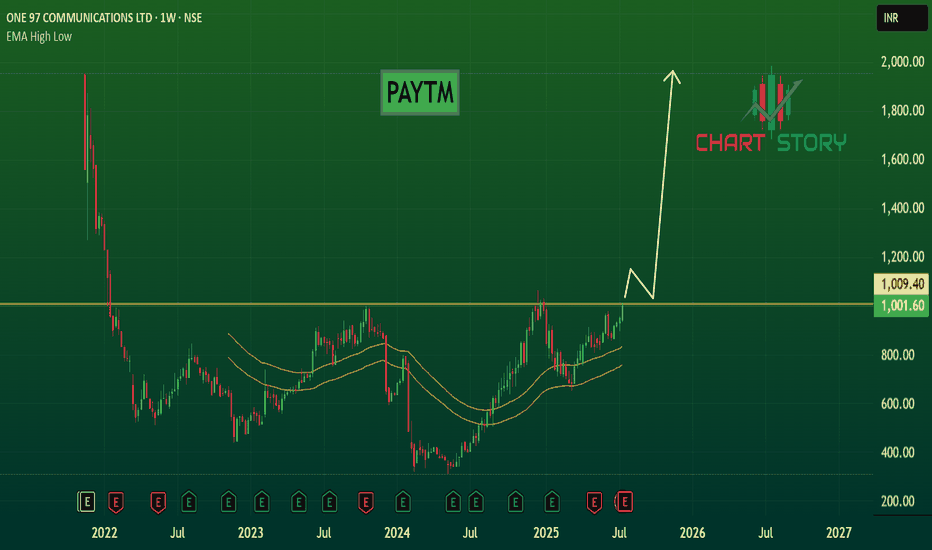
NSE:PAYTM Weekly price action looks like once final lap crossing it looks like price will double in short span of time.
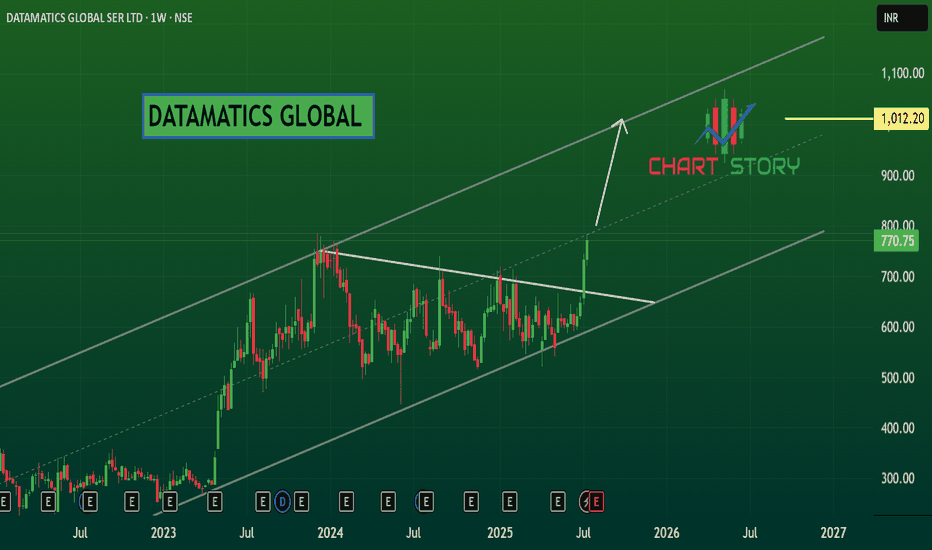
NSE:DATAMATICS Weekly classic momentum formation will continue price like fast to furious in short term.
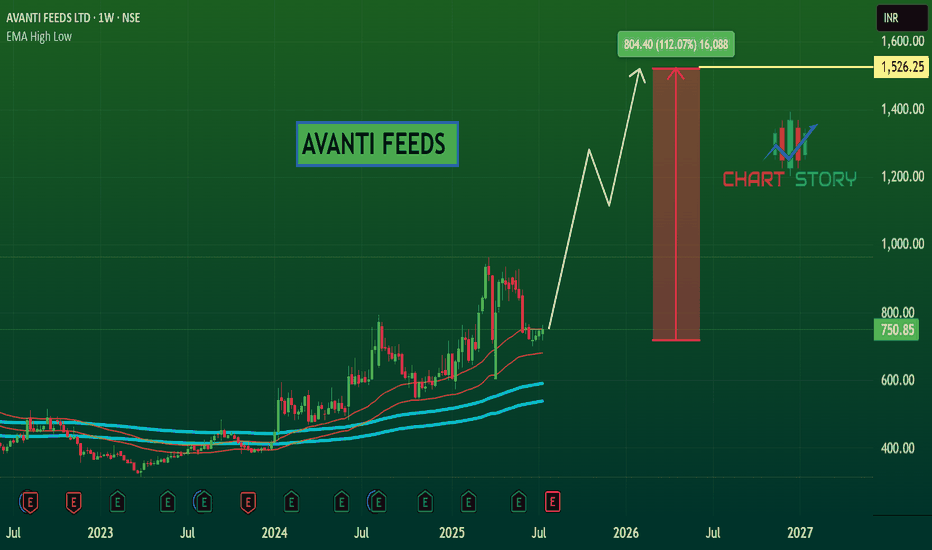
NSE:AVANTIFEED Wave momentum with extreme upside momentum seen on weekly chart.
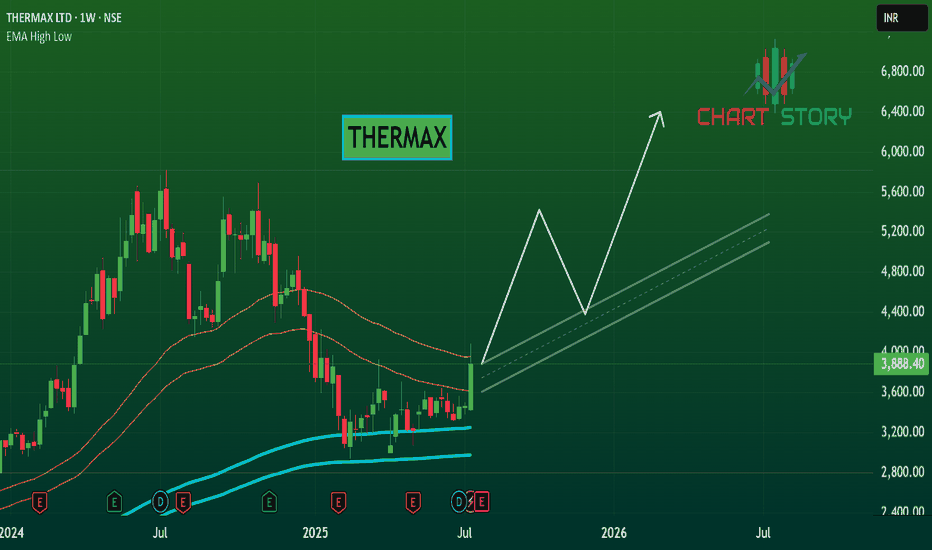
NSE:THERMAX Weekly rounding bottom trade with momentum , may continue more upside in medium term.
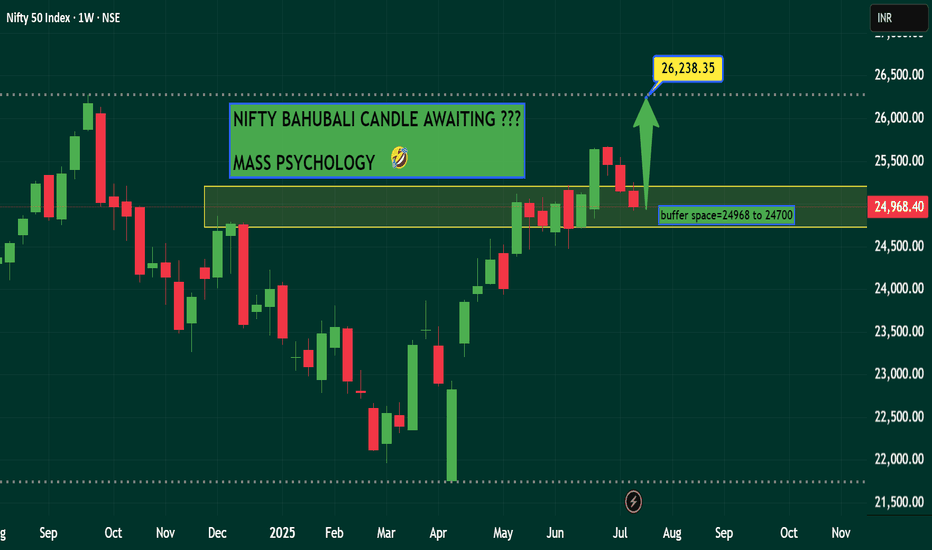
NSE:NIFTY Weekly chart showing negative closing from last three weeks, but undertone of the market showing something big to come on price. Rsi giving positive divergence on intraday timeframes.
NSE:CENTENKA Weekly rounding bottom at location may continue further trend.
NSE:INDUSTOWER Breakout stock with momentum indicators and multiple timeframe.
NSE:NCLIND Breakout stock with multiple timeframe analysis and momentum indicators.
NSE:RAMCOCEM Breakout stock with momentum and multiple timeframe .
NSE:IFBAGRO Breakout stock with multiple timeframe and momentum indicators.
NSE:JUBLPHARMA Breakout stock with momentum and bullish on multiple timeframes.
NSE:SMLISUZU Breakout stock with momentum indicators and bullish on multiple timeframes.
NSE:PRIVISCL Breakout stock on multi timeframe from qty , weekly, daily charts. momentum indicators also in force.
