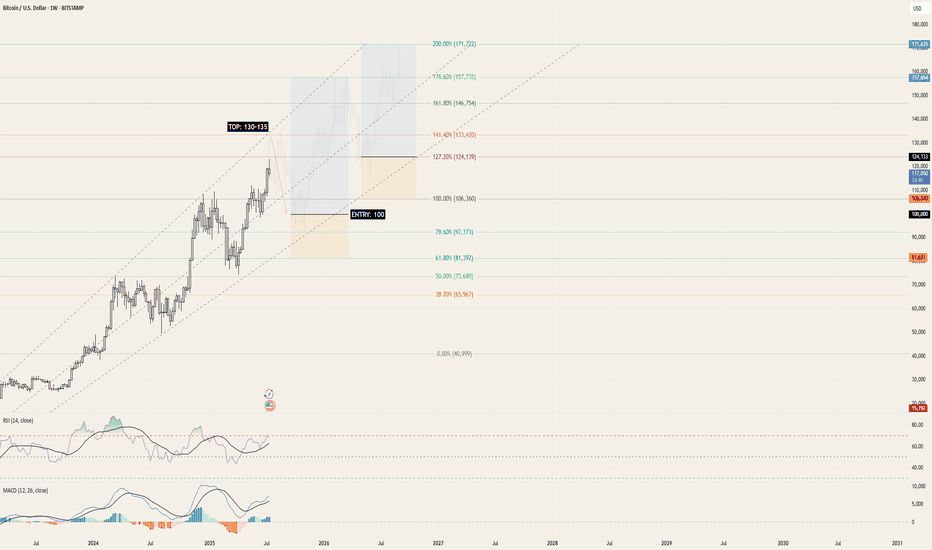
Continuing the current upwards trajectory, using Fibonacci trend analysis, we'll reach BTC's peak for 2025 @ 130-135k within the next few months. By the end of the month / beginning of 2026, BTC will be back to 100k - this is where this strategy begins. Enter @ 100k between the 78.6% and 100% Fibonacci levels, setting a comfortable SL down to the 61.8%...
*at the time of writing. Get yours now! TO THE MOON! 🚀
Starting today BITSTAMP:BTCUSD is currently at 60,900 - the mid-point between 80,000 (next all-time high) and 45,000 (following low). Which way will we go? To the moon, of course 🚀🌖 We're currently at the bottom of the first shoulder in a typical head-and-shoulders pattern that we've commonly see Bitcoin perform. Strong downward resistance shows that while...
Ideal entry point is below 40k (ETA: 2-3 weeks). Target is then the 69% Fib level (69k) (ETA: 3-5 months). 1000 pip movement and TP. Wait for sell-off to end. Re-enter below 60k (ETA: Sept-Nov 2024). Target is then the 127% Fib level (98-100k) within H2 2025. To the moon!
Excuse the mess, but I had to post this. Historically we've always seen the price re-test new substantial highs. I predict a re-test upwards of 49k within the next 4-5 weeks. Till then, expect the price to trend lower, potentially dipping below 38k (this is a solid buy-in spot) before re-testing. Important things to note - we've approached (and tested) the 1:1...
As simple as that. We're heading to all-time highs because when in doubt (or in a recession), buy Gold.
We've finally recovered from the crash that lead to the price plummeting through the 20-year-long support price. Next, we return to the 7-year-long trend. In a perfect world, we'd wait for the price to drop back down to ~1.0400 before opening a long position. We might just see the USD market thrive (or, in the very least, perform a little less poorly) during...
We just broke through a 20 year-long support 1.03 . Not to mention the 7 year-long range. Temp support 1 and 2 are not far off from the historic low of 0.82 .
It's no secret that we're heading into a global recession in 2023. The question is, will the Crypto market feel the effects too? At the start of 2021 we saw massive buying power come into play and the Crypto market boomed. We saw a 250% increase in prices over 2018's boom before it promptly imploded during mid-late 2022. The previous "dead period" lasted for...
Short-term support between 1920 & 1930 . Previous all-time high is the new medium-term support between 1870 & 1880 . Phase 1/3: Bulls need to break back into previous channel, time window: 5 days. TP: 1975 - 1980 Buy back in when (new) temporary support test happens @ 1955 .
Bulls will retest most recent resistance of 12400. Failure to break-out will result in a short down to around 11500. Expect limited momentum in the next 5-7 days. Quick short followed by long.
As Brexit uncertainty looms and the British economy is put under more and more pressure, we can see the possibility of the Cable returning to its all-time low @ around 1.20000 (a drop of 800(0) pips from it's current location). It differs from the uptrend of 2017 in that the bull and bear fights are a lot shorter-lived as short-termism becomes a factor in...
Previous price zone has been breached (see this chart for previous zone: ) and we are finally seeing strong downwards movement into our next trading zone. We can now expect all future trades to take place within the 1.15800 - 1.08000 range. I am now anticipating the pull-back and re-test of the previous bottom/support @ 1.15000 - this will provide the perfect...
Wait for re-test of 38.2% Fibo @ 0.0019470 (0.0019500 is a reasonable buy price). TP: 0.0020500 SL: 0.0019050 Take profit half way and re-enter.
Here we go again - for the 5th time this year. Will the Australian dollar be able to break free from it's downwards plummet against the US dollar? Or will we see yet another bounce off of the VERY strong resistance? I think we might just. But for now, let's put our faith in the dollar to climb up to the resistance. More updates soon.
It would seem that the Fiber is ranging in an upwards trend with the next movement expected to be downwards back towards the 50% weekly Fib line (1.15300). NFP is also coming up in a few days and expectations for the dollar are low. Is the recovery of the EURO finally happening? Will be updating this chart regularly and doing an NFP-day update on the day.
So here we go, the big break-out we've been waiting for - or is it? Let's assume that the USDJPY pair continues it's upwards march towards it's June 2015 high, we're then looking at 3-6 months worth of upwards movement and thousands of pips. To enter such a series of trades, we need to start with a good entry zone. In this case, TA shows that somewhere back below...
Trade active. TP1: 1.16500 TP2: 1.16200 SL: 1.17900 R/R: 3.0 Supporting factors: S&P and DJIA up 0.3% and 0.6% respectively US CPI to rise 0.2% Weaker EUR economy, lead by weak German production Head and shoulders pattern


![[BTC] Ramblings of a Fibonacci Trader BTCUSD: [BTC] Ramblings of a Fibonacci Trader](https://s3.tradingview.com/f/fM15vkrT_mid.png)

![[EURUSD] 2-year trading plan EURUSD: [EURUSD] 2-year trading plan](https://s3.tradingview.com/k/KzN6KnpQ_mid.png)


