We are in a difficult situation but the risk at this point if we take a Long position will be small but if we not they will be a perfect entry , in other hands if we are wrong we can have a good rewards on the short position, so I will take a long position with a possible lost them I will have another position ready to get Long. The only problem that I will need...
Levels of entry before fed decision 110.900 Long AND Short 110.200- 110.053 The two target indicated will be the result to the end of the years depending of the rate up or down, if the rate remain the same I will expecting short they only will make get up will be if in the meeting after the decision of interested rate decision , if they mention that by November...
This particular patter it is a particular structure on reversal setting up
This patter it is a combination of a Fibo+Triangle+ MACD
Expectation LONG base on strong consolidation on the 50%
We are very closed to get LONG this week
I think nothing it is change on BITcoin to go long a part of the gap, until the end of the month and the clarification on the split on BiTcoin we will not get a clear direction on BiTcoin, so my expectation will be go short again and by the end of July and depending of the news go Long again
Base on a simple calculation RSI and MACD the FTSE need to get up to 7412 them will make the decision to go Long A1 or Short B1
Base on a channel weekly this pair will go LONG for at least a month
I am working on AUDCAD and the rest of the pairs CAD to get Long at the moment we are in a continuation on very strong CAD that in my opinion this will be end this week what will be a good entry on Monday morning , if I I am wrong I will go into PLAN B, because there is a very strong on short AUD/CAD we maybe have a few 100 pips down.
Base on my mathematical calculation an patterns this will be the ideal for tomorrow The same patterns on this days 30/09/2013, 02/03/2014 and 30/03/2016 Base on mathematical probabilities tomorrow USD will go long but If I am wrong always PLAN B :) Good Luck and remember 2% of your account not more
I will work on that this weekend
Do nothing when the market it is not clear , just do nothing this it is my idea , just WAIT and Wait better to do not make money that look for wrong trades and loose money. Good Luck
Works very good on Daily on other like 4 hours can help but not that simple an good like this one. Since 19/04/2017 Long Lost*** Small lost Short Lost*** Small Lost Long Win *** Very Big Win Short Win ** Big Win Long again just open until another short How this works if you see two candles open in one direction follow by another red in the 5 candles you go...
My expectation with the very small data it is to to go Long but it is very difficult ... Patterns base on big movement, very simple on MACD, to go long an short base on MACD structure on Daily breaking levels Remember do not risk more that 2 %
In the last 2 years this patterns only happens 3 times an this one will be 3 option They have a % of probabilities to be correct on 100% with and average of 613 pips profit to go Long PLAN A If I am wrong them I will go to PLAN B Good luck
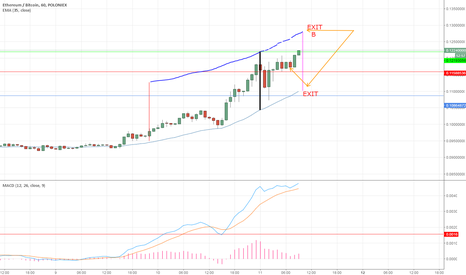
Now that we know the exit on our stop lost we can get out on the top levels If you see the black like connected with the EMA35 them to the max projection on this rally If you follow this levels will indicate the EXIT on the top level when it is over value, what will be a good indication of exit
In this rally The best option will be in 1H base on the chart EMA-35 This will be the best indicator to get out from the trade the Blue Line, this will continue up in a save distance if this break my advice will be to get out. The red line indicate the bottom on the last red candle if this will break will be a continuation to the down side In summary you will...


