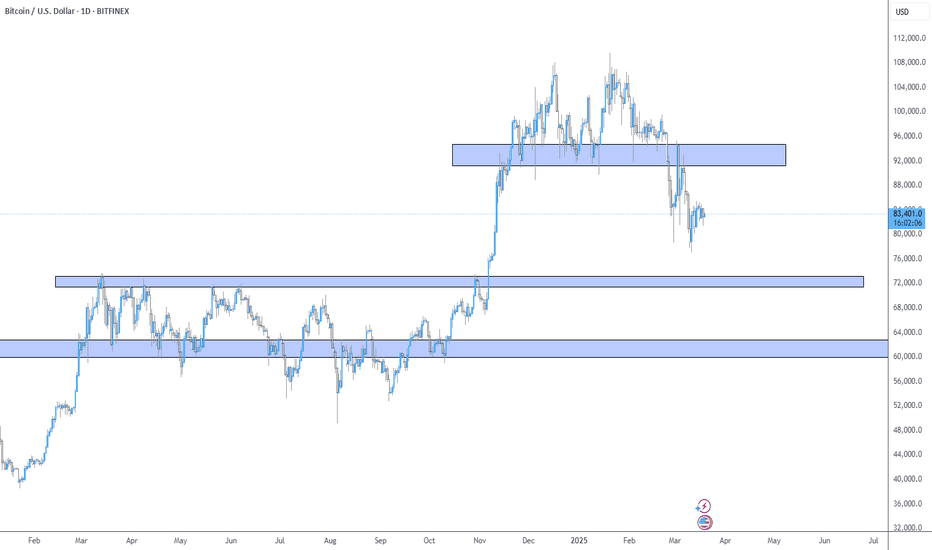
Summary: We know that most big cryptos are making moves towards the downside, the question is how long will this last. Is this a typical crypto correction, or have the markets become bearish? We know this happens a lot based on history, so my predictions are this correction won't last much longer as many big cryptos are sitting and rejecting at major support...
Where do you expect price to move in the future? Price is at a nice support level, and crypto is still continuing it's correction to the downside. Is the bear run over?
Here are my simplistic zones that price has been respecting and will most likely follow. Do you think Bitcoin will pull down to the support levels below? I see price making a slight move towards the support levels then contesting resistance for new highs. Based on history, we know how crypto tends to move in these months. COINBASE:BTCUSD
We have now reached a zone that has been hit twice in the past 11 or so years (Jan 19, 2016 and March 19, 2020) as seen on the chart. Will we see this respected zone once again? THIS SELL PROVIDED IS NOT OFFICIAL, ONLY FOR DRAFT!
If you have taken this trade, look at taking profits now! I'd expect a pullback before the next large move.
Although we're completely trading against the bears, Bitcoin has hit "rock bottom" and we re correct itself sooner than later. Make sure you're trading re-tests for confirmation so you don't get over turned by the bears!
EurCad is creeping up for the textbook trend, and the pullback being right at the .618 fib retracement. Don't take the trade the second it reaches the level (if it retraces), look for rejection and certain candlestick patterns. In the long future, I would like for price to pull all the way down to the 0 level (bottom) of the fib, and make a double bottom and...
Drawing the Fibonacci from the high to a pull back leads us to the .618 profit zone, where price is currently. Next, we're at a very strong zone where price will be determined bullish or bearish for the upcoming months once broken. Make sure you watch carefully! My personal prediction is that price will make new highs, targeting 200 zone then 220.
With momentum still looking bearish, but lots of consolidation and mini higher highs, we can see a bullish move! The "Earnings and Revenue" is coming up, so this could be the spark of this move. Be careful, this is trading against the trend. Don't make a move until a break and retest happens.
Perfect Retracement from the first retracement coming up to the 718 range, then the second mini retrace hits the golden zone.
Trend and market structure approach Top trend line is institution liquidity
Ethereum has rejected at the 71% Fib, and is contesting the previous higher high (Textbook trend pullback) BUY THE DIP BEFORE IT GOES FOR NEW HIGHS!!!!
Please do not execute a trade until we see a retest! If you do so, I would recommend selling this pair due to the bears being in control. If it does continue up to the 50% and even 61.8% Zone (which I see happening before a big move to the downside). This trade might require patients for most traders due to this being drawn on the Daily and 4HR Chart. I am not...
EURUSD Has been hanging above this zone since this first of December 2020, and is now retesting this zone February 1st..... What a coincidence. This doesn't mean anything, but a good way to look at this zone. If price decides to stay above or break out below this zone. I'll be looking for a retest to get a sniper entry! What're your guys thoughts?
USDCHF Has been bearish for quite some time now. Price has came up to the 78.6% Fib Retracement and rejected right at that price value. Will it head back down for lower lows? THIS TRADE IS NOT GUARENTEED, PLEASE TRADE AT YOUR OWN RISK.
Bitcoin is rejecting at the highest point Bitcoin has reached since 2017. If this does break the highest high, I see a bullish market and typical crypto movement. Please read below what my markups are. Pink- Highest price point including wick Red- Highest price point not including wick (candle) Gold- Golden zone for Fib. retracement (in between 50% and...
USDJPY is sitting on the 78.6% Fib Retracement Can we see a reversal to the up side and see higher highs? It has been trending since May 6 2020 and hopefully made it's retracement


