Contrarianeyeview
Looking for a bounce from channel bottom to retest 56/7k in wich will be a very important lvl to break for bullish continuation in the short term trend , a loss of this channel would most likely bring us down to the 47-42k range for a full Fib retrace, note we have held the 618 fib with genisis confluence , nice r.r with a short hedge on a loss of stop and...
So far we have made our retrace to the first main support zone, noted to watch for long in last analysis (scalpers already in nice profits) watch for a move upwards prior upwards sloping support now resistance or a swing down to the 78.60% fib point, our first buys have been executed with a tight stop below wick, we may trail this stop depending on price movement.
A follow up on our last analysis on track
1. Wait for a break out of prior ATH resistance and sell fibs,. 2. or a 50% retrace with break out validation. 3. If break down to primary C wave Short. So far we have 2 of 4 target zones hit from previous analysis.
Most recent Fib res ring update (SL/SH) As you can see we are sitting right on our new fib-ring/circle , may trace downward to the 50-40% retrace range following this fractal., may offer a nice long on reaction to this retrace shaking traders that went long from the upper mid-line of prev channel. Market cypher / Fractal analysis
Fib Resistance Ring now broken, watch for close above channel (yellow) or above main (Blue) channel medium line extending to the channel bottom with KR Band confluence, or a move up into our next Fib ring.
Bullish Pitchfork Channel resistance and support ranges with Fib / K.R Confluence
All in the chart bio/t.a descriptions
trendline extrapolation for bull flag break target, also note we are back into our bullish channel on the midline resistance point . key to break this yellow channel, good new with a close inside or above, (above is long signal 1 if confluence with other indicators in play
Support ranges
Invalidation level (prev 4h short fractal printed )
In the chart, Invalidation pivit.
Caught the first buy signal, forming another on current 15m candle.
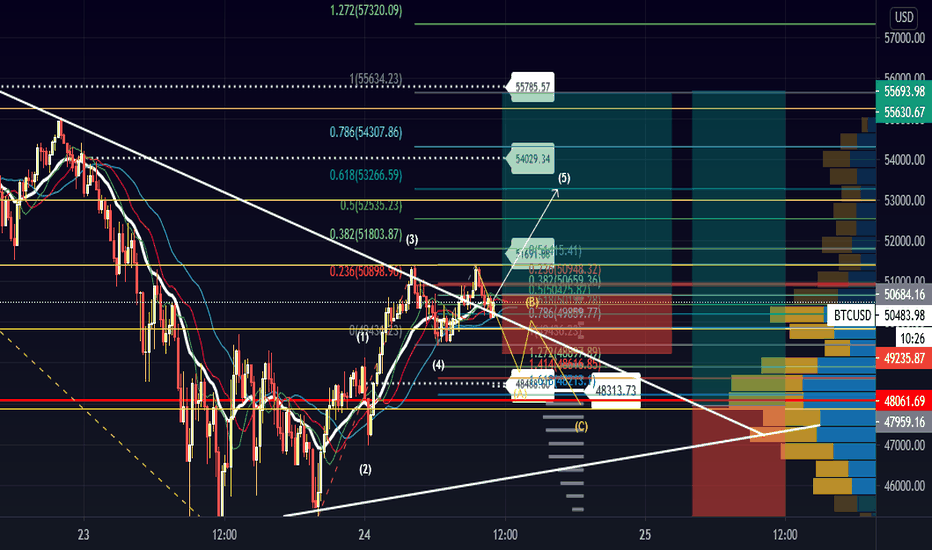
Waiting for a break out confirmation from triangle for a wave 5, Shorting the C if validated would be a little to risky in this range,. Daily buys are Down at 42kish
Hit our long signal box given on Feb 19, now will be trailing stop to profit waiting for add confirmations ,. hope you all took this easy long from our bounce zone, if we do not make a daily inside bar I will look to long the lower box given in related chart (when to go long) TY, W.Watts
keeping eyes on the money flow.
Looking like we are Inside wave 3 of 5 being ABC from 5 (Submicro) or wave 4 off Our larger wave 3, a few fib zones to hit from 42k-37k (many other price levels but keeping it simple. we may have a flat b wave close to prior ATH. , or we will set a B wave on this current daily candle alot lower. time will tell. , holding above 42k would be a nice clean count.
CHART = Our Low time frame res and Elliot wave count labels.


