Crocobot
Short position for the major pair means a long position for its mirror form . Sl and tp are indicated in the chart .
Here is a long position for CHFUSD. SL abd Tp are both shown in the chart .
Last two anglaises were both wrong as far as furtherer study of the crocobot shows
Trade ratio of above 10 and a mid term position make this trade a nice call for every investor .
The British pound slipped against the dollar, having risen the day before after the Federal Reserve's policy meeting, while investors were playing down the impact UK local elections on Thursday might have on the currency. The pound GBPUSD was last down 0.1% against the dollar at $1.2509, having risen 0.3% the day before after Fed Chair Jerome Powell ruled out...
USDCAD on H4 time frame is signaling a short position . All trade coordinates are in the chart
A short position here at H1 for EURCHD . SL and TP are both set right at the chart
AUDCAD short is a position here and SL /TP are here on the chart
Ratio for this trade is around 3 and the signal is AUDUSD short
H1 time frame is signaling a way better trade . SL and TP are mentioned
Ratio is above 5 and this long position seems like a good one for today .
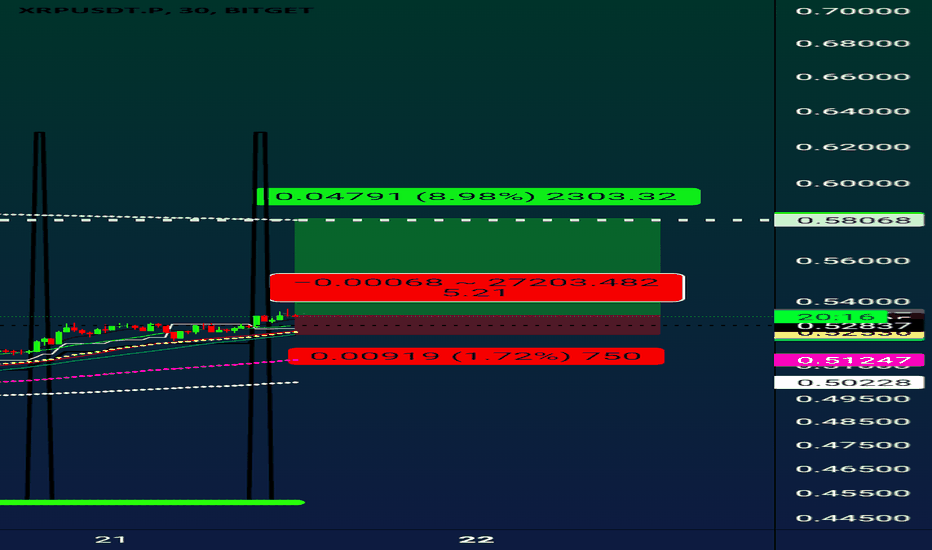
Bitcoin bulls are back here in this 30m chart. Take profits and stop loss levels are both indicated in the chart.
USDCAD is long at a H4 chart . All the essential key levels are clearly shown at the chart
In a recent appearance on Fox Business’s “Mornings with Maria,” hosted by Maria Bartiromo, Ripple CEO Brad Garlinghouse provided insightful commentary on the current state and the future of the cryptocurrency market. Garlinghouse opened the discussion with an overview of the cryptocurrency market’s performance, noting a significant uptick in the past six months,...
GBPNZD H2 is showing a long position which is both likely and probable
A look at the mirror chart of this trading pair shows a heavy bear run for the next 200 days
GBPAUD is along position for everyone. ! Long live the queen .
USDJPY is about to break from this range any time now. .


