Crypto-By--Ghazi
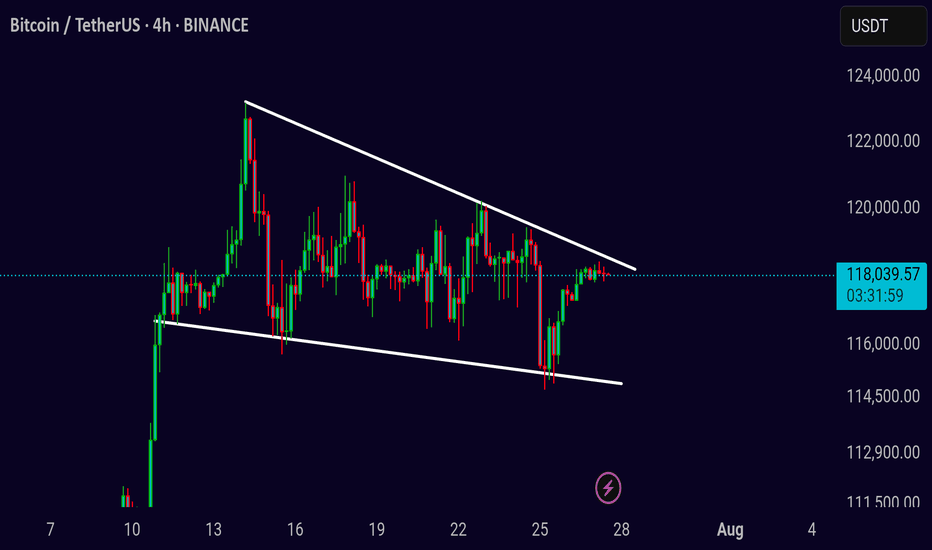
PremiumBTC is moving within a falling wedge and is making its fourth breakout attempt. A successful breakout and retest of the wedge would confirm a bullish trend, while rejection could signal further movement within the wedge.
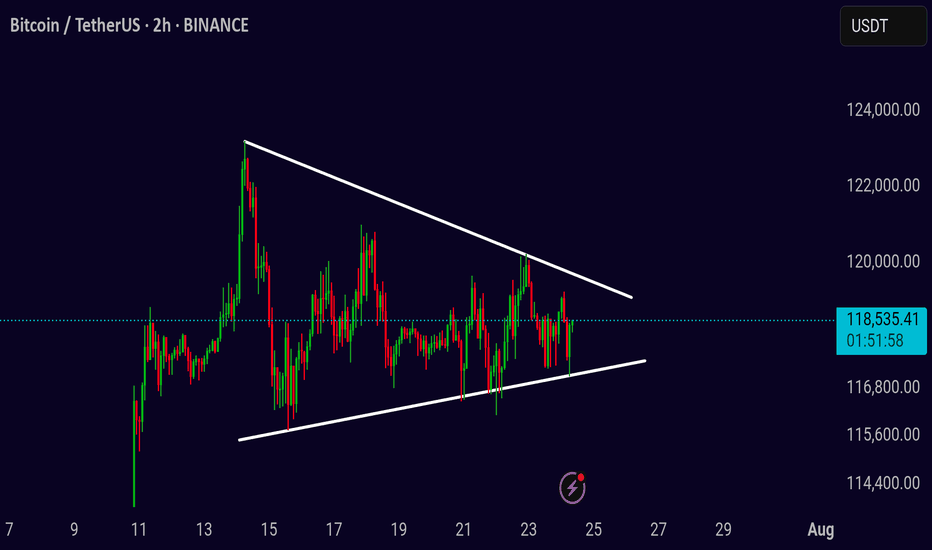
BTCUSDT Idea (2H Chart) BTC is consolidating inside a symmetrical triangle, creating pressure for a breakout. Price is currently ranging between 116K–120K, with volatility compressing. Patience is key here — don’t rush entries. A confirmed breakout or breakdown will give the real direction. Break above the triangle = bullish continuation Break below = further...
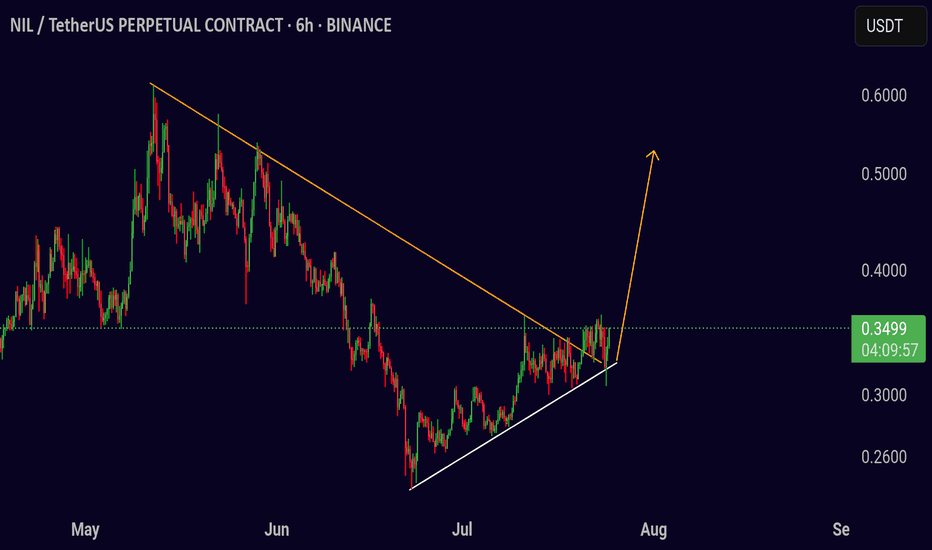
Trading Setup: A breakout is seen in the NIL/USDT pair (6h). Price can move towards the following targets. ⬆️ Buy now or Buy on 0.3500 🛑 SL @ 0.3200 🔵 TP1 @ 0.3800 🔵 TP2 @ 0.4100 🔵 TP3 @ 0.4500 Risk Warning Trading crypto, futures, and CFDs involves risk. Only trade with margin you can afford to lose. Past performance does not guarantee future results. If you...
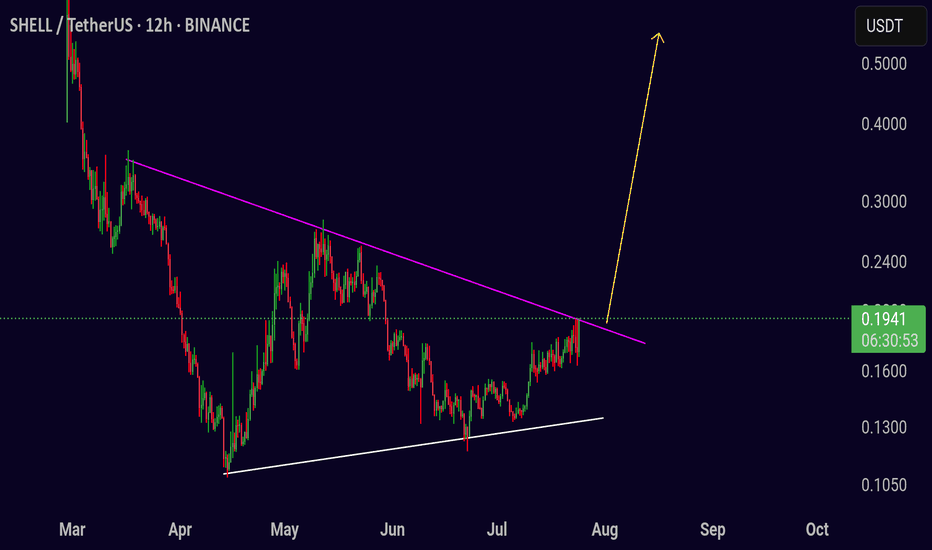
Trading Setup: A trading signal is seen in the SHELL/USDT pair (12h). Traders can look for a breakout entry as price is approaching a key resistance level on the chart. ⬆️ Buy now or Buy on 0.1900 🛑 SL @ 0.1500 🔵 TP1 @ 0.2800 🔵 TP2 @ 0.4000 🔵 TP3 @ 0.5000 What are these signals based on? Classical Technical Analysis Price Action and Trendline Breakout RSI,...
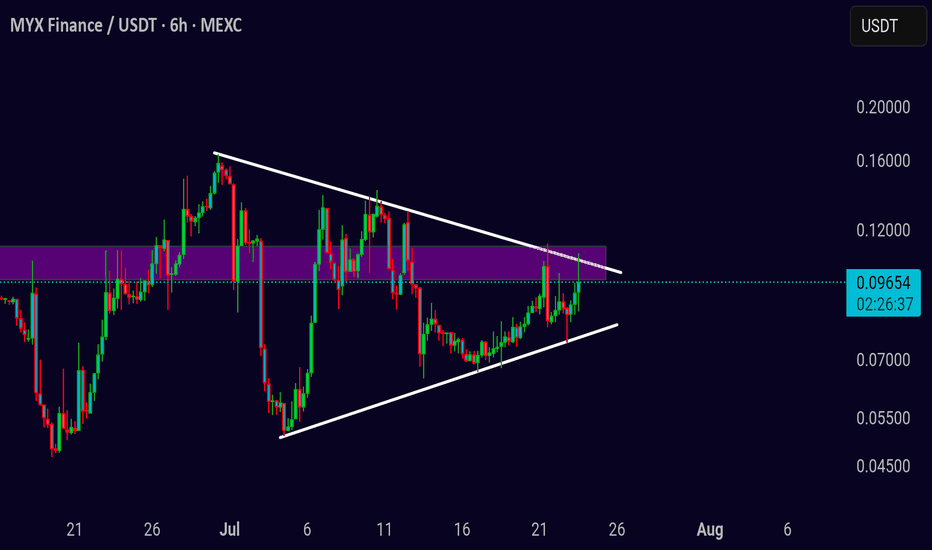
Pair: MYX/USDT Timeframe: 6H Structure: Symmetrical consolidation and breakout watch MYX has been consolidating within a tightening structure, forming higher lows while repeatedly testing the descending resistance line. Price is now trading near the upper boundary and within a key supply zone, suggesting that a decisive move could be close. Bullish case: A...
Pair: POWR/USDT Timeframe: 8H Structure: Descending trendline breakout watch POWR has been moving within a broad descending structure and is now testing the upper trendline with price pushing into the resistance zone around 0.2000. Momentum is building as it tries to break out of the prolonged downtrend. Bullish case: A confirmed breakout above 0.2050 with...
Breakout Strategy for HEI/USDT: Key Resistance Tested The HEI/USDT chart is currently consolidating under a clear descending trendline, signaling a potential breakout. As price approaches this key resistance, the market is poised for a critical move. Will HEI break higher or continue lower? Let’s break down the potential scenarios. Bullish Breakout...
The CHESS/USDT chart is currently consolidating in a symmetrical triangle pattern, signaling that a breakout could be imminent. As the price squeezes within converging trendlines, the next move is critical. Will the price push higher or drop lower? Let’s take a closer look at the potential setups. Bullish Breakout Opportunity If the price breaks above the upper...
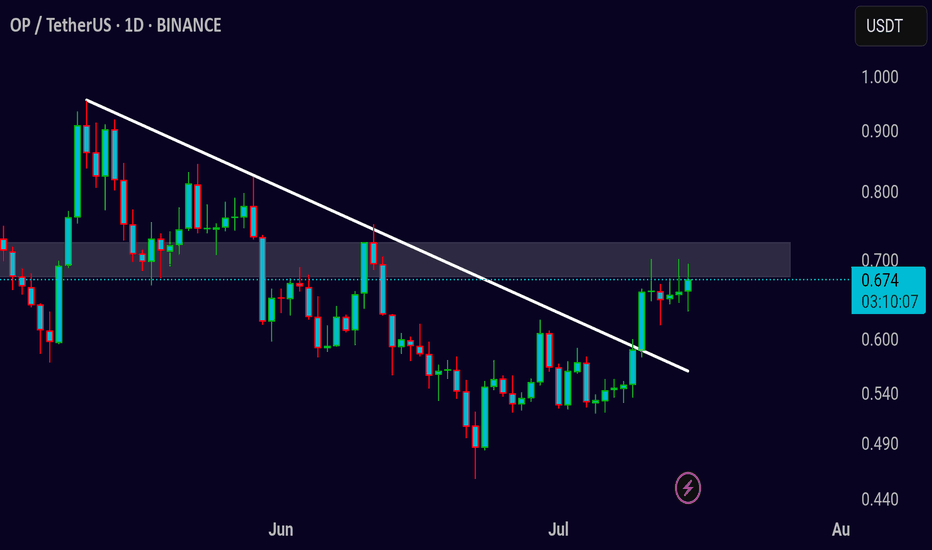
Symbol: OP/USDT Timeframe: Daily Chart Analysis: The price is currently approaching a key resistance zone at around 0.673, as seen in the chart. A descending trendline from May to June has been acting as resistance. The price has recently made a strong move towards this resistance zone, showing a potential breakout pattern. If the price successfully breaks...
Pair: PNUT/USDT Timeframe: 4H Pattern: Symmetrical Triangle (Breakout Confirmed) PNUT has broken out of the symmetrical triangle, showing early signs of bullish momentum. To confirm strength, price must now hold above the breakout zone near 0.2400. Bullish continuation: If it holds, we could see upside targets around 0.2700–0.3000 in the short term. Volume...
**Pair:** FARTCOIN/USDT **Timeframe:** 1H **Pattern:** Symmetrical Triangle FARTCOIN is consolidating around 1.1820 within a symmetrical triangle on the 1H chart. This structure usually signals a breakout is near — but the direction remains uncertain. **Bullish Case:** If the price breaks above the upper trendline with strong momentum, we could see a...
Pair: FUN/USDT Timeframe: 1H Pattern: Symmetrical Triangle FUN is consolidating inside a symmetrical triangle, but recent candles show pressure on the lower trendline. Price is hovering around 0.0070 and just tested the ascending support. This structure usually leads to a breakout — but the direction will depend on how price reacts in the next few...
PNUT/USDT – Breakout Watch from Symmetrical Triangle Chart pattern: Symmetrical Triangle Timeframe: 4-Hour Published: June 20, 2025 PNUT/USDT is nearing the apex of a symmetrical triangle that has been forming over several weeks. The price is tightening between rising support and descending resistance, indicating a breakout is likely approaching soon. Price is...
AAVE/USDT – Symmetrical Triangle Squeeze on 4H Chart Pattern: Symmetrical Triangle Timeframe: 4-Hour Published: June 20, 2025 AAVE/USDT is currently consolidating within a symmetrical triangle. Price is respecting the rising support near the 243–245 zone, while being squeezed by a descending resistance around 263–265. This pattern typically leads to a breakout as...
Pair: CAKE/USDT 💱 Timeframe: 1D 📅 Pattern: Head and Shoulders Top 🧠 CAKE is developing a clear head and shoulders pattern on the daily chart, often seen as a bearish reversal setup. Price is currently testing the neckline support around 2.18, which also aligns with an ascending trendline. A breakdown here could trigger downside continuation. Bearish scenario...
Pair: HEI/USDT 💱 Timeframe: 6H ⏱️ Pattern: Symmetrical Triangle Consolidation 🔺 HEI has been coiling tightly inside a symmetrical triangle since April, with price nearing the apex. This setup usually precedes a strong breakout or breakdown. Momentum is building — a major move looks imminent 🔍🔥. Bullish Breakout Scenario ✅ A 6H candle close above 0.36 confirms...
Pair: ANIME/USDT 💱 Timeframe: 1D 📅 Pattern: Ascending Trendline Test 📉 ANIME is currently testing a key ascending trendline on the daily chart. This structure has supported price action for weeks, and the current candle is sitting right at the trendline, suggesting a potential inflection point 🔍⚖️. Bullish Scenario ✅ If the trendline holds and price rebounds...
Pair: SOLV/USDT 💱 Timeframe: 1D 📅 Pattern: Inverse Head & Shoulders 👕 (Reversal Setup) SOLV is forming a clean inverse head & shoulders pattern on the daily chart, with the neckline resistance sitting near 0.046–0.047. Price is currently retesting this area, signaling a potential breakout attempt 🔍📈. Bullish Scenario ✅ A daily close above the neckline (>0.047)...
