CryptoChartDaily
Price has respected the ascending trendline for a second time (🔴 arrows), signaling strong support around the $0.08 zone. The bounce from this level is accompanied by increasing volume and a bullish hook forming on the WT_CROSS indicator from the oversold zone – a classic reversal signal. A daily close above $0.095 could confirm continuation of this emerging...
Price is testing a rising trendline that has held strong since late June. Previous bounces from this level (🔴 arrows) led to significant upward moves. Volume shows accumulation near this trendline, and the WT_CROSS indicator is near oversold, hinting at a possible bullish bounce. If support holds, we could see a short-term reversal back toward the $0.10–$0.11...
Price consolidating near $0.327 after a pullback from recent highs. Momentum indicators are recovering from oversold levels, suggesting a possible short-term bounce if $0.30 support holds. Watching for volume to confirm any move toward $0.35–$0.38. Disclosures: This analysis is for informational purposes only and is not financial advice. It does not constitute a...
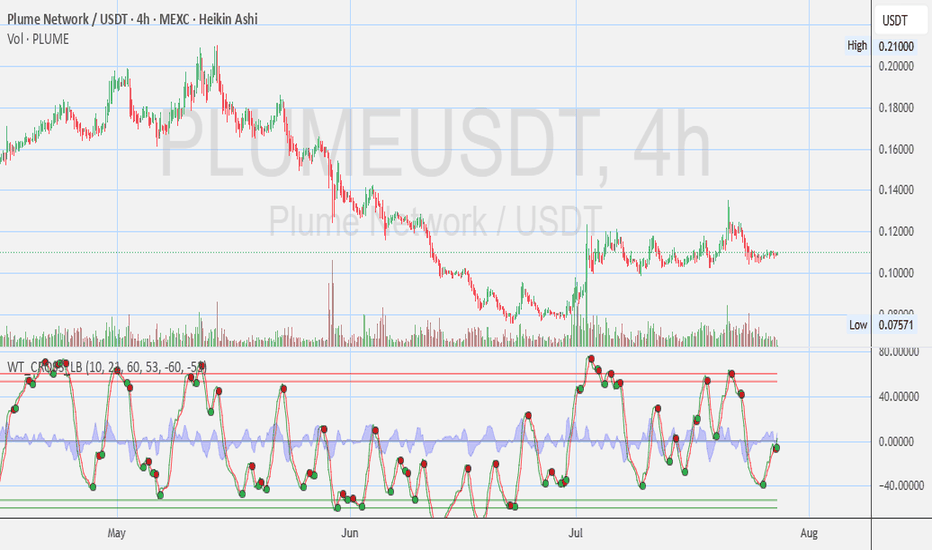
PLUME/USDT (4H) Looks like the tide is turning! 🌊📈 PLUME is showing higher lows and steady support above $0.10, with momentum indicators pointing upward. If volume picks up, we could see a test of the $0.13–$0.14 zone soon. Watching for confirmation as the uptrend builds. 🚀 Disclosures: This analysis is for informational purposes only and is not financial...
GORILLABSC/USDT (1D) Update Price at $0.00182, up +9% today from recent lows near $0.00110. Momentum (WT_CROSS) and volume suggest the early signs of an UPTREND forming, but a clear move above $0.00200 is needed to confirm bullish momentum. Disclosures: This analysis is for informational purposes only and is not financial advice. It does not constitute a...
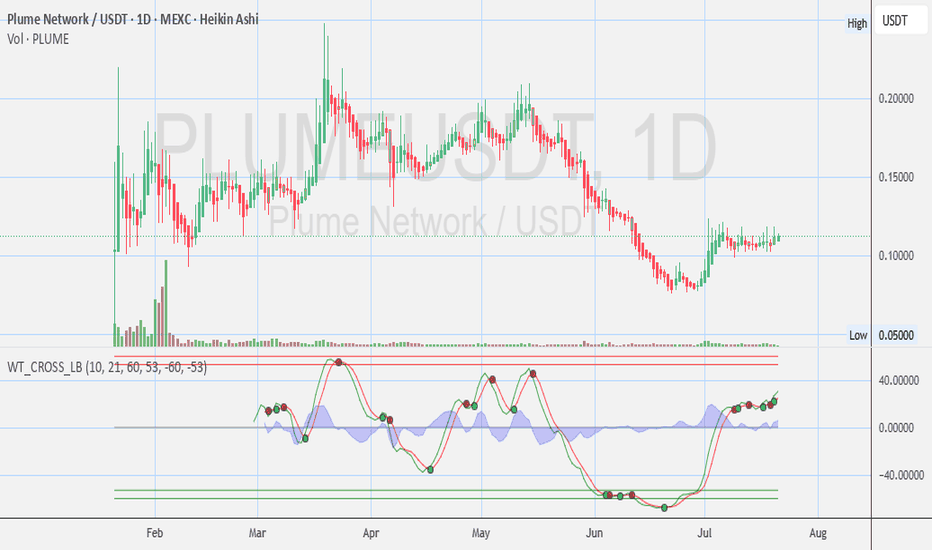
Price holding steady near $0.11, consolidating after June recovery. Momentum indicators (WT_CROSS) show a gradual bullish bias, but confirmation needed on a breakout above $0.115 for stronger upside potential. Disclosures: This analysis is for informational purposes only and is not financial advice. It does not constitute a recommendation to buy, sell, or trade...
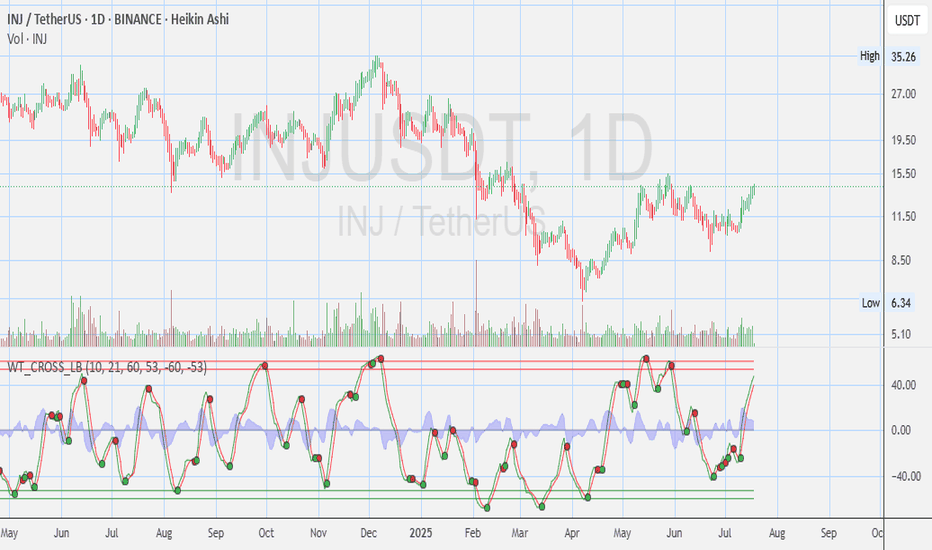
Here’s a detailed **technical analysis** of the chart you uploaded for **INJ/USDT (Injective Protocol)** on the **1D (Daily) timeframe** using **Heikin Ashi** candles and the **WaveTrend Cross Indicator (WT\_CROSS\_LB)**: --- 📊 **Current Price Zone:** * **Current Price:** \~\$13.59 * **Sell/Buy Spread:** \$14.18 Sell / \$14.19 Buy * **Daily Range:** \$12.83 –...
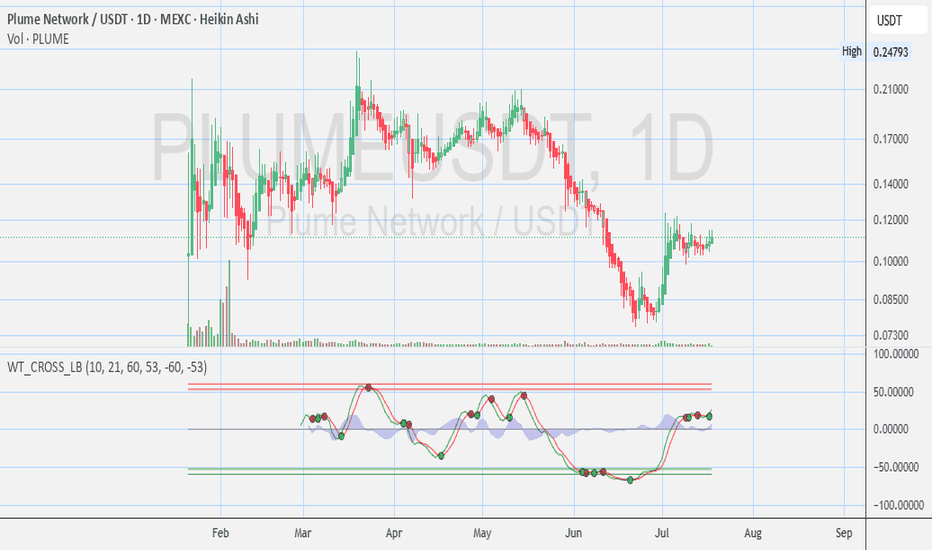
Here's a breakdown and technical analysis of the **PLUME/USDT (1D, Heikin Ashi, MEXC)** chart you provided: --- 📊 **Chart Overview:** * **Current Price:** Around **\$0.1115** * **Price Action:** Currently in a short-term **uptrend** after a significant downtrend. * **Volume:** Noticeable **increase in volume** during the recent reversal in early July, indicating...
-- Disclosures: This analysis is for informational purposes only and is not financial advice. It does not constitute a recommendation to buy, sell, or trade any securities, cryptocurrencies, or stocks. Trading involves significant risk, and you should consult with a qualified financial advisor before making any investment decisions. Past performance is not...
📉 Trend Overview - AVAX has been in a clear downtrend since mid-May, - steadily declining from ~$27 to the current ~$18. - Multiple lower highs and lower lows are evident, confirming bearish market structure. 🔍 Price Action - Price is currently testing a key support zone around $17.50–$18, - near previous consolidation zones (seen in April and February). -...
📉 Trend Overview Major Downtrend continues — price has collapsed from above $0.05 to current levels around $0.00047, a >99% drop. 📈 WaveTrend Oscillator (WT_CROSS) WT oscillator is deep in the oversold region (below -40), which often indicates exhaustion in the downtrend. - Green dot printed on the oscillator = possible bullish crossover signal. - However,...
technical analysis of the Plume Network (PLUME/USDT) – Daily (1D) chart on MEXC with Heikin Ashi candles: 📉 Overview & Current Market Conditions Price: ~$0.13566 Change: -2.17% (down today) Chart Type: Heikin Ashi (smoothed candle view) Trend: Clear downtrend in place since mid-May Market Structure Tools: BOS, CHoCH, EQH, Weak/Strong Highs & Lows 🔍 Key...
Here is a technical analysis of the Swarm Markets (SMT/USDT) 1D chart on MEXC (Heikin Ashi candles): 📊 General Overview: Pair: SMT/USDT Chart Timeframe: 1 Day (Daily) Exchange: MEXC Candle Type: Heikin Ashi Current Price: ~$0.056 Daily Change: +3.85% Volume: Slight pickup recently Indicators on chart: Market structure (CHoCH, BOS, EQH/QL), Liquidity Zones 🔍...
$KBBB 4 Hour Chart: Stoch RSI Shows Potential Reversal Momentum. Any Opinions for ? Trend Reversal? - First sign of reversal after prolonged downtrend. - CHoCH and volume spike give early bullish confirmation. Next Target Zones: - If upward move continues, next resistance sits around 0.000850 – 0.000900. - A confirmed close above 0.000100 could target 0.003000...
1 Hour Chart: Stoch RSI Shows Potential Reversal Momentum. Any Opinions? Disclosures: This analysis is for informational purposes only and is not financial advice. It does not constitute a recommendation to buy, sell, or trade any securities, cryptocurrencies, or stocks. Trading involves significant risk, and you should consult with a qualified financial...
45-Min Chart: Stoch RSI Shows Potential Reversal Momentum Any Opinions? Disclosures: No positions. This analysis is for informational purposes only and is not financial advice. It does not constitute a recommendation to buy, sell, or trade any securities, cryptocurrencies, or stocks. Trading involves significant risk, and you should consult with a qualified...
Disclosures: No positions. This analysis is for informational purposes only and is not financial advice. It does not constitute a recommendation to buy, sell, or trade any securities, cryptocurrencies, or stocks. Trading involves significant risk, and you should consult with a qualified financial advisor before making any investment decisions. Past performance...
WHOEVER IS BEHIND THIS GAME – I won't be surprised if THEY want to hit the BLUE line. Indicators & Volume Volume Spike at Bottom: A large green volume bar formed during the last leg down, suggesting potential bottom-fishing or short covering. BOS Labels ("Break of Structure"): Several BOS points during the decline confirm the bearish structure. No bullish BOS is...


