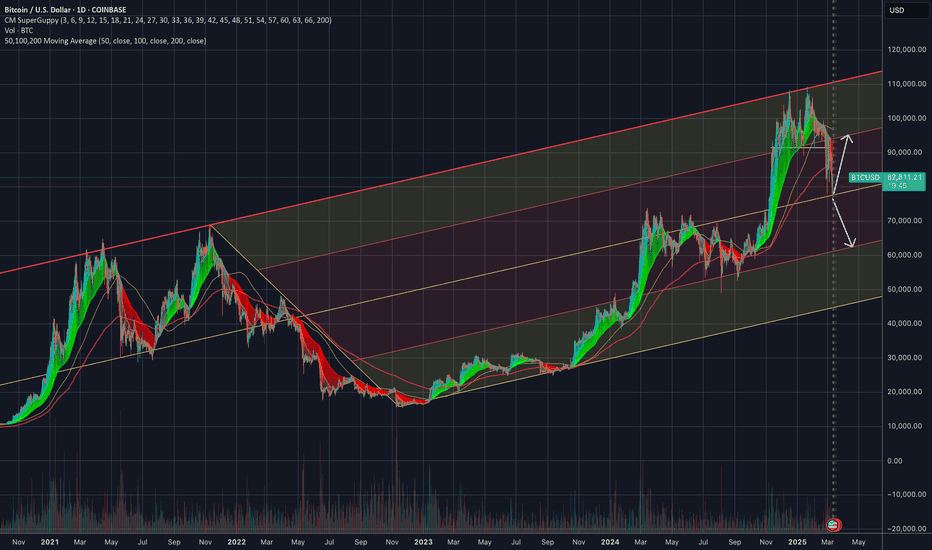
BTC is currently within its long-term ascending channel but has shown strong rejection at the upper boundary (~$100K). A pullback toward the mid-channel support (~$70K-$75K) seems likely, aligning with historical retracement patterns. Indicators Show Weakness: RSI Divergence suggests a slowdown in momentum. MACD hints at a potential bearish crossover. 📉 Key Levels...
Trying to see what the bullish outlook is for #BTC, however I am finding a lot more bearish arguments at this stage then bullish. Looking at the Daily, Weekly and Monthly Chart: - RSI printing Bearish Divergences - Failing to break above the heavy pitch-fork channel formed since 2017 Highs through to the highs in 2021. Daily: - 50MA is approaching closer and...
Following basics, we break out of support lines, now next levels of support are on the fib lines... What you think? Not rocket science really for CRYPTOCAP:ETH
Will we Ripple down or bounce from here. Invalidation zones are as shown.
It seems like BINANCE:OMUSD has completed its final 5th wave, are we about to finally enter the correction phase? OM has been really strong in its rally considering the rest of the cryptospace has been lagging behind.
Channel started forming since 2017, always remember, till we break out of the channel, it is all noise about going to $1m... COINBASE:BTCUSD
If history is to repeat similar to 2021, expect COINBASE:BTCUSD to retrace to $76k, $76k is also where the CME Gap is as well, looking at this channel that has withstood time and the short-term trend. I do believe $76k is going to happen.
BTC has broken out of its upwards channel and is looking to make further downsides with a bear flag in play now it seems COINBASE:BTCUSD
Inverted Head shoulders looking to be playing out which will retest the previous short-term highs at 0.625, once this area can be cleared 0.63 will be in play as that lines up perfectly as well with the 0.618 fib retracement.
Technical Overview The COINBASE:BTCUSD weekly chart suggests a bullish setup, with a Bullish Flag pattern and Descending Broadening Triangle playing out. Current price action shows BTC retesting previous resistance as new support around $67,000. Support and Resistance: - Support: The zone at $67,000 serves as immediate support within the flag pattern. -...
The SOL/USDT chart suggests a possible 5th wave completion at the $210 level, aligning with the ascending channel’s upper boundary and the 1.618 Fibonacci extension from previous lows. This target is feasible if bullish momentum continues, breaking through intermediate resistance levels around $183 (0.382) and $202 (0.786). The 5th wave is often an impulse wave in...
If OIl breaks doesn't hold from the descending triangle, we may be looking at OIl going to previous resistance, which should now be support at $40
Current Setup: - Bullish Flag and Descending Broadening Triangle: Bitcoin is in a consolidation phase, with a bullish flag potentially forming within a larger descending broadening triangle. Bullish Scenario: - If Bitcoin breaks out above the current consolidation (around $60,000), the bullish targets could be $64,945 (8.17% move) and potentially up to...
Current Setup: - Bullish Flag and Descending Broadening Triangle: Bitcoin is in a consolidation phase, with a bullish flag potentially forming within a larger descending broadening triangle. Bullish Scenario: - If Bitcoin breaks out above the current consolidation (around $60,000), the bullish targets could be $64,945 (8.17% move) and potentially up to...
The latest chart you've shared illustrates the bullish flag and descending broadening triangle pattern within a larger uptrend. If the bullish scenario plays out, the targets can be anticipated as follows: 1. Bullish Target 1 at $85,643 : A breakout from the current flag could lead Bitcoin towards this first major resistance level. 2. Bullish Target 2 at ...
The chart is still showing a bearish trend with the price trading within a descending channel, indicating a consistent downtrend. Key Levels: - $200 Resistance: The failure to reclaim and hold above $200 reinforces bearish sentiment. - 0.618 Fibonacci Support at $165: This level is the next major support within the current downtrend. A break below...
COINBASE:BTCUSD Bull Flag in Play: The daily chart shows a bull flag pattern still in play. Although there was a brief breakout above the flag, the price has since pulled back into the channel, indicating indecision. - Support and Resistance: - Support: The first target zone around $51,000 has been tested, providing immediate support. - Resistance: ...
COINBASE:BTCUSD Bull Flag in Play: The daily chart shows a bull flag pattern still in play. Although there was a brief breakout above the flag, the price has since pulled back into the channel, indicating indecision. - Support and Resistance: - Support: The first target zone around $51,000 has been tested, providing immediate support. - Resistance: ...


