BTCUSDT Binance 4H hollow candlesticks A descending parallel Channel has been formed, after the ATH (all-time high) at 110165$. We can expect a price correction about 67338$ that is exactly the red line, as also the price drops to 62,000 and a flash a wick to 52 -53,000$. The bar pattern (flipped fractal) has been formed from a previous movement, indicates a...
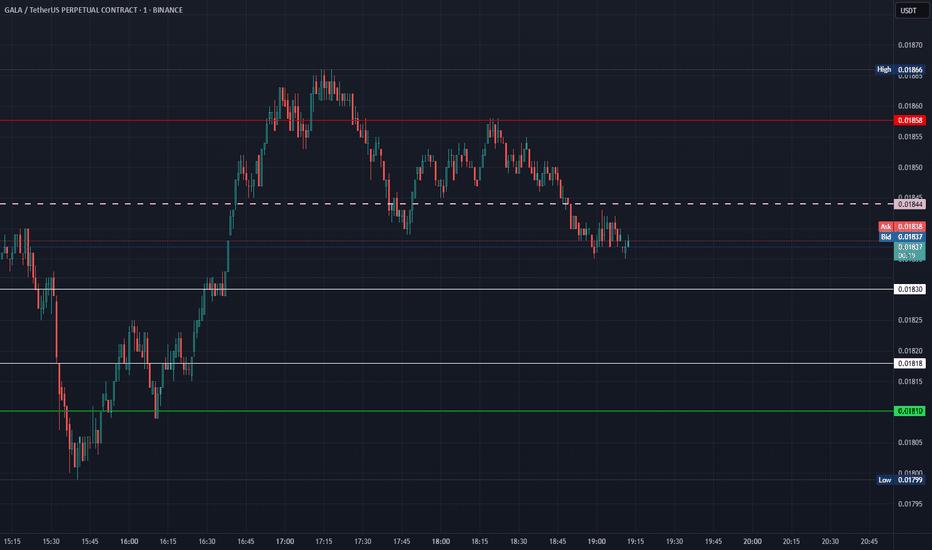
GALA/USDTPERP Binance 1m hollows Open profits to current position
GALA/USDTPERP Binance 1m hollows Open profits to current position
BTC/USDTPERP Binance 4H hollows the price is holding JUST above the trendline!
BTC/USDT Binance 1D Hollow Candlesticks After a price correction, a support area results from extending the golden ratio of the last Fibonacci retracement. Also, there are multiple resistance levels, with the price needing to break $73.777 to move higher. A symmetrical triangle chart pattern has been formed, as it is a period of consolidation before the price...
BTC/USDT Binance 4H Hollows Currently, the Support level is predicted by the extension of the golden ratio of a Fibonacci Retracement. Also, an ascending triangle has been formed, where the rule says that since the price entered from below, at the end of the triangle, the price will move up. Forecast and Path indicates a possible future movement. Market Cap:...
BTC/USDT Binance 4H hollow candlesticks After a price rise of +25%, a Fibonacci channel has formed, combined with an Ascending triangle. As there are also new Support & Resistance points. From here, we can conclude the following: At the end of the Ascending triangle, there will be a price break out. The price must break the golden ratio of the Fibonacci...
BTCUSDT Binance 4H hollow candlesticks How the price of Bitcoin (BTC) is expected to react to the introduction of an Exchange-Traded Fund (ETF) and the halving event. Analyzing the Potential Impact of ETF Approval and Halving on Bitcoin's Price Bitcoin, the pioneering cryptocurrency, has been subject to notable price volatility, attracting attention from...
BTC/USDT Binance 4H Hollow Candlesticks As the bull run continues, a parallel bullish channel has formed. If the price break out this channel, a new TA is needed. A Rising Wedge has also been formed, where the rule says that is generally a bearish signal as it indicates a possible reversal during an uptrend. Rising wedge patterns indicate the likelihood of...
BTC/USDT Binance 1H Hollow Candlesticks Since the price broke the parallel ascending channel, we saw a rise of around 40%. Currently, the Support level is predicted by the extension of the golden ratio of a Fibonacci Retracement and the Resistance level is at 38K. Also, an ascending triangle has been formed, where the rule says that since the price entered...
BTCUSD Bitstamp 1D hollow candlesticks Here we see a symmetrical triangle, as well as a parallel ascending channel, has formed starting from 04/01/2023. A Fibonacci retracement indicates the Support area, If the price falls it breaks the symmetrical triangle down. The extension of the Golden section of the Fibonacci retracement shows the next point of Support,...
30 min hollow candlesticks In the present phase, a symmetrical triangle has been formed, where a price breakout is expected soon. For Nick <3
BTC/USDT Binance 4H hollow candlesticks Since mid-March, a sideways movement continues between $25860 and $31000 as an All-Time High (ATH). In the present phase, a symmetrical triangle has been formed, where a price breakout is expected soon. The Support area occurs from the extension of the golden ratio of the last Fibonacci retracement. The Resistance area...
BINANCE:BTCUSDT Binance 4H hollow candlesticks After the price breakout, we saw an all-time high (ATH) at $31000. The beginning of the Support area, results from the extension of the upper point of the first Fibonacci retracement, combined with the extension of the golden ratio of the second Fibonacci retracement. It seems that an uptrend parallel channel...
BTC/USDT Binance 4H hollow candlesticks After a +30% gains, a consolidation movement follows. It seems that an asymmetrical triangle has been formed. The rule says, that since the price entered from the bottom of the triangle, the breakout will be occurred upwards. The extension of the golden ratio of the Fibonacci retracement, indicates the main support area...
BTC/USDT Binance 4H hollow candlesticks As the price successfully followed the path and the forecast indicator. After a correction a bars pattern (fractal), shows a consolidation (sideways movement), between the Support and Resistance areas. A new bars pattern (fractal) and a forecast indicator shows a possible scenario, the next bull run will occur once the...
ETH/USDT Binance 1D hollow candlesticks As the bear market is over, we can say a few things for the price movement of altcoins. A descending triangle has been formed, as the price already breakout this triangle. Also, a parallel uptrend channel has been formed since the beginning of June 2022. A first resistance area occurred from the extension of the first...
BTC/USDT Binance 4H hollow candlesticks After the price broke out of the uptrend parallel channel, as it break up all the previous Resistance areas, a huge pump followed. For the next week, we can expect a consolidation between the main Support and Resistance areas. The Support area is resulting from the extension of the golden ratio of Fibonacci...


