This chart tracks the current decline in the dollar's value and compares it to two instances since 2018 when significant dollar depreciation coincided with sharp increases in Bitcoin's price.
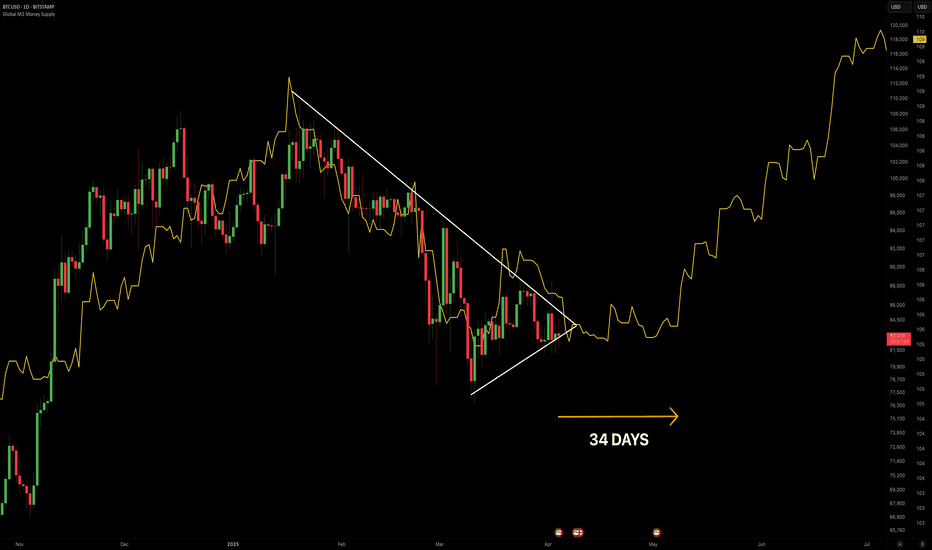
Following the global liquidity with a 109-day delay, the price of BTC should consolidate between the upper 70s and low 80s until the first week of May before increasing back to over $100,000 and eventually to new ATHs. This will coincide with the Strategic Bitcoin Reserve purchase in the US. P.S - incredibly impressed with how Bitcoin is holding up whilst the...
Looking at the parabola pattern for Bitcoin, it has played out perfectly this cycle. I'm expecting one final push on BTC's price before a plateau. Since the average price appreciation after RSI trend line breakouts are ~70%, I think anywhere between a $175,000 - $180,000 Bitcoin can happen relatively soon!
I’ve just created an interesting chart comparing this current cycle to the previous halving. While it may not follow exactly, I believe we might observe significant similarities. My conclusion is that leading up to the halving, Bitcoin tends to (on average, excluding the COVID wick) drop by 17-18%. This leads me to believe that a $34,000 BTC is definitely...
Examining the historical data from the last two Bitcoin halving cycles on the chart, it becomes evident that, when considering the price movement on a logarithmic scale over a bi-weekly timeframe, it took an average of 15.5 periods for the value to surpass the previous peak. With this in mind, it is plausible to anticipate Bitcoin reaching $69,000 by early October...
On the Bitcoin 1W chart, we can see a clear resemblance of a Wyckoff distribution that could cause BTC to have a healthy retest, at least to the $30,600 area, in the upcoming weeks. I personally don't believe we will go below $25,300, as coming up to the halving, a significant drop like such would be very rare.
Bitcoin is currently in the process of forming a double top pattern on the 1H chart, if the neckline is broken, then we could see a correction to $26.3k....
Bitcoin's volatility is currently at an all-time-low meaning we haven't seen major price changes in a very long time. This is incredibly rare for a very volatile asset such as Bitcoin, although the uncertainty in the markets fueled by recession thoughts is the likely cause of this.
Bitcoin is forming a cup and handle pattern on the Daily chart, and is currently close to breaking out. Although we can't know for sure if it will break to the upside or downside, Cup & Handle patterns are known to be bullish, therefore, the potential bullish target is available on the chart.
As you can see Bitcoin is forming a bearish divergence on the 4 hourly chart which could cause a short-term reversal in price to the two potential support lines.
As you can see we formed a symmetrical triangle on the 1H chart for Bitcoin and perfectly broke down by the height of the triangle. Following that we saw a v-shaped recovery and now we can see a bull flag is forming for BTC, and although bull flags have a higher probability of breaking to the upside, we saw a death cross on the 1H with the 50MA and 200MA. In...
On the chart above we can see a clear diamond bottom forming on Bitcoin's 4 hourly chart. This formation could cause BTC to rise to the level of $17,500 where it is also proven to be a diligent support. Lets see if the next few candles can manage to break the resistance of the pattern, which I believe is likely as we have a bull flag forming on lower timeframes.
The RSI is forming a bullish divergence on the weekly chart for Bitcoin, we saw previously at the ATH and the prior high before that, formed a bearish divergence on the weekly chart and resulted in the current bear market that we are in. Therefore, the bullish divergence on the chart above may cause a significant upward movement on the price of Bitcoin, although...


