CryptoNuclear
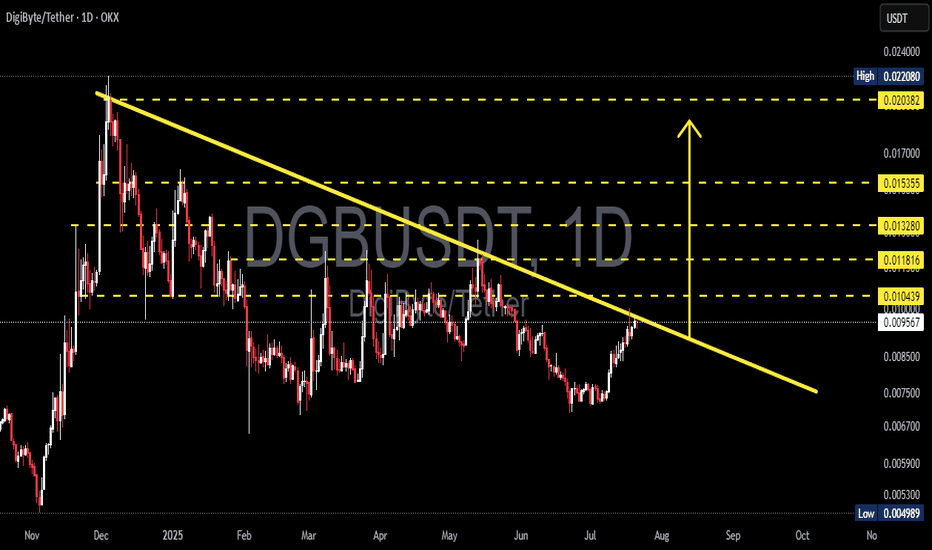
Premium📉 Pattern: Falling Wedge / Descending Triangle Breakout DigiByte (DGB) is currently showing a high-probability breakout from a descending trendline that has held price action in check since December 2024. This structure hints at weakening selling pressure while buyers have started forming higher lows, suggesting potential momentum shift. 🔍 Chart Structure & Key...
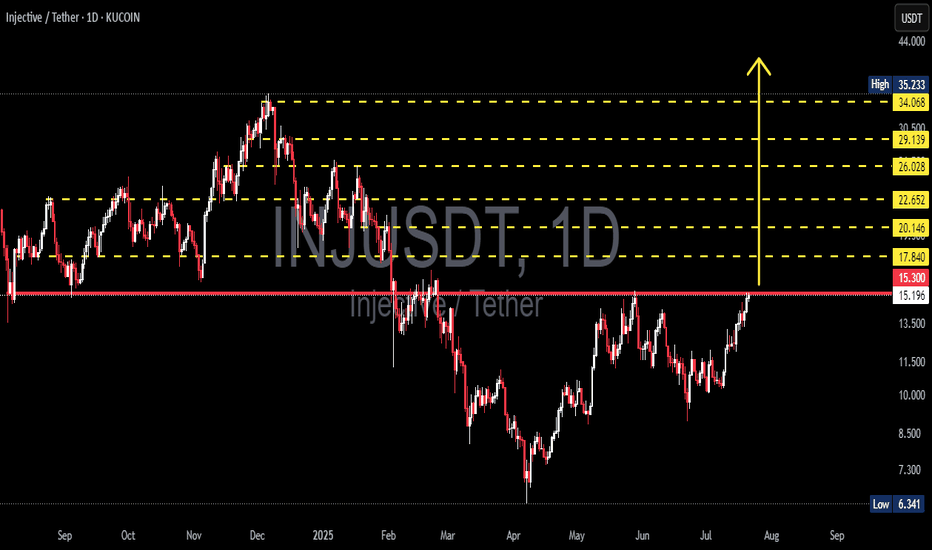
🧠 Full Technical Analysis (Daily Timeframe - KuCoin): INJ/USDT (Injective Protocol) is currently at a critical decision point, testing a major resistance zone that has held strong since early 2025. After months of consolidation and a consistent structure of higher lows since May 2025, bullish pressure is now building momentum. 📊 Chart Pattern: Ascending...
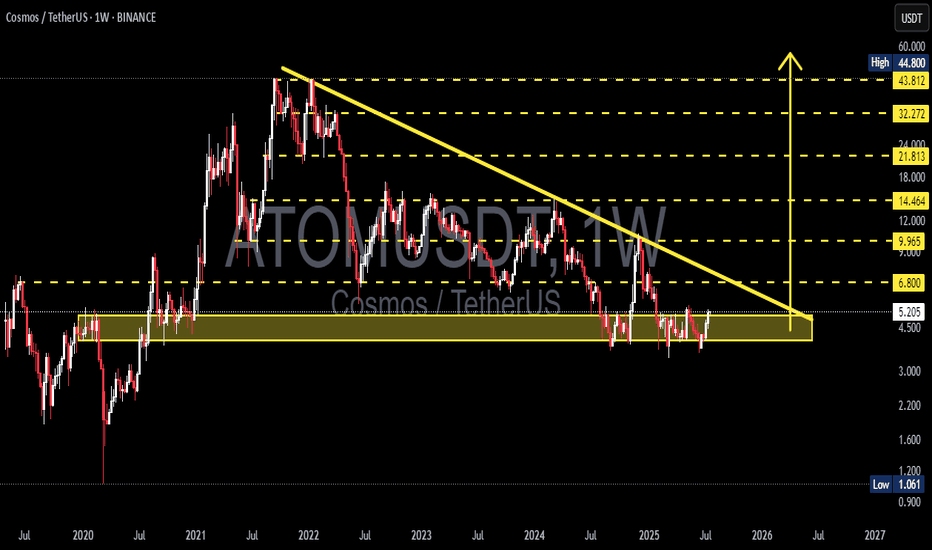
📊 Full Technical Breakdown: 🟡 Long-Term Accumulation Zone ATOM is currently trading within a horizontal accumulation zone between $4.50 and $5.20, which has held strong since early 2021. This key area has acted as a solid floor across multiple market cycles, suggesting strong buying interest from long-term holders or institutional participants. 🔻 Descending...
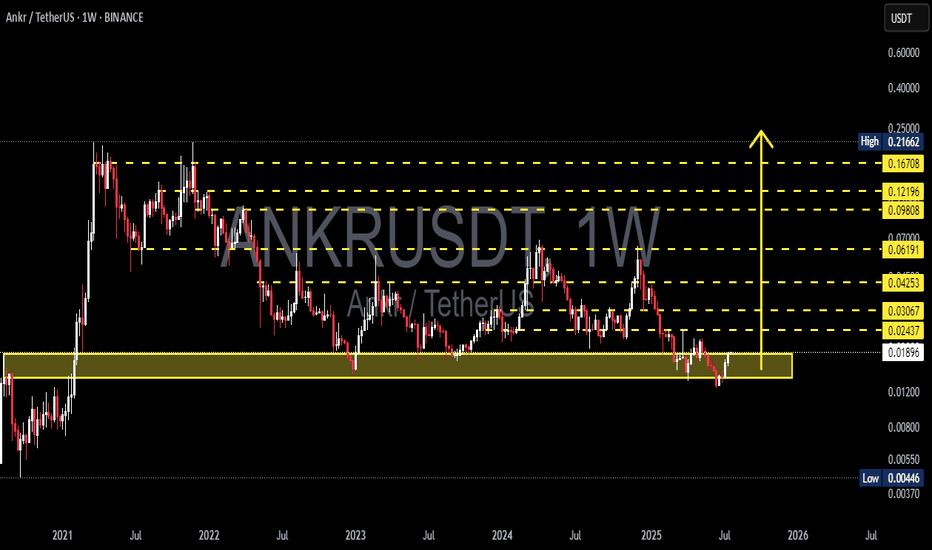
🧠 Analysis Overview: ANKR is showing strong signs of a potential macro reversal after bouncing off its historical demand zone around 0.017–0.019 USDT. This zone has proven to be a significant accumulation area in past cycles — fueling major rallies in both 2021 and 2023. The recent reaction at this level could mark the beginning of a substantial bullish leg in...
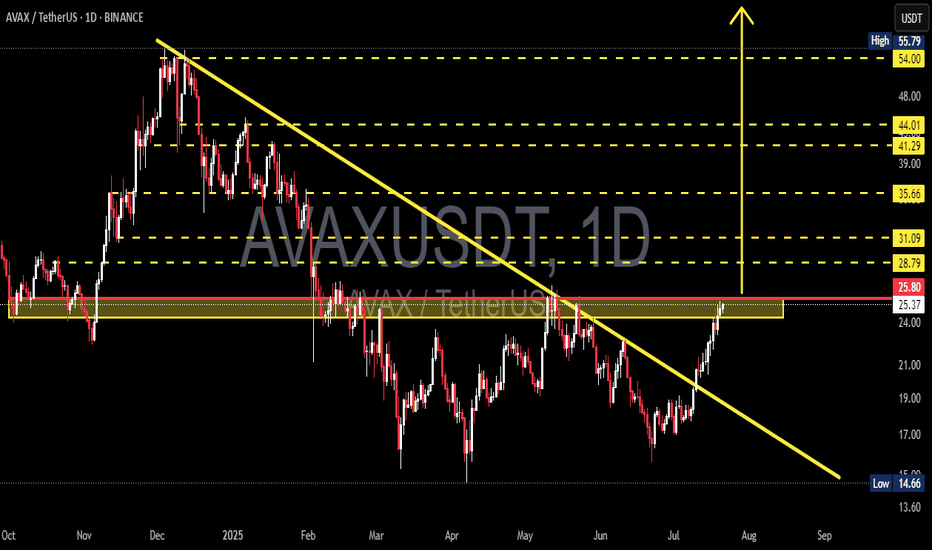
AVAX has just delivered one of its most technically significant moves in recent months. After spending over 8 months trapped under a descending resistance line, price action has finally broken free — suggesting a potential trend reversal and the beginning of a much larger bullish phase. 🧠 Pattern & Structure Breakdown: 📌 Descending Trendline Breakout AVAX had...
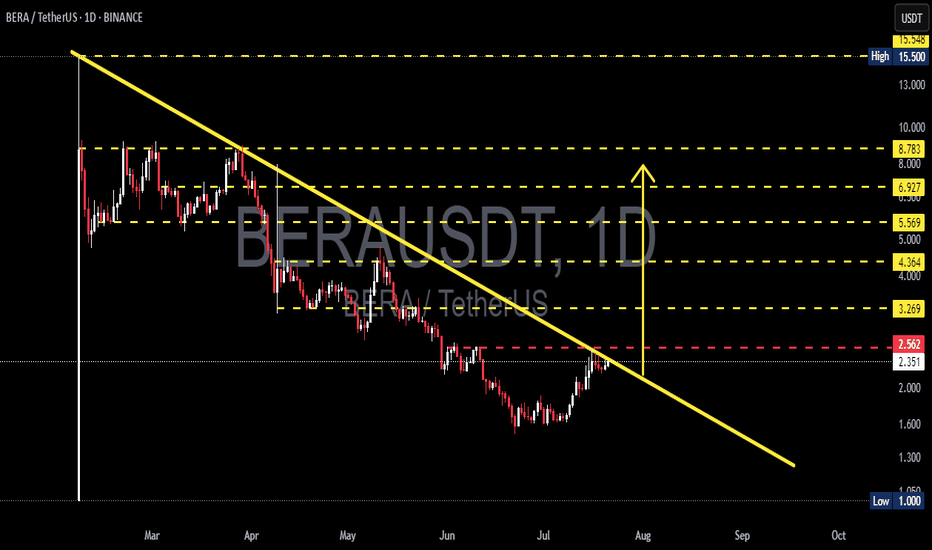
📊 Full Technical Analysis The BERA/USDT pair is displaying a highly compelling structure on the daily time frame, where the price has formed a Falling Wedge / Descending Triangle pattern over the past 4+ months. This type of pattern often signals a large-scale accumulation phase by smart money, followed by an explosive breakout once selling pressure is exhausted...
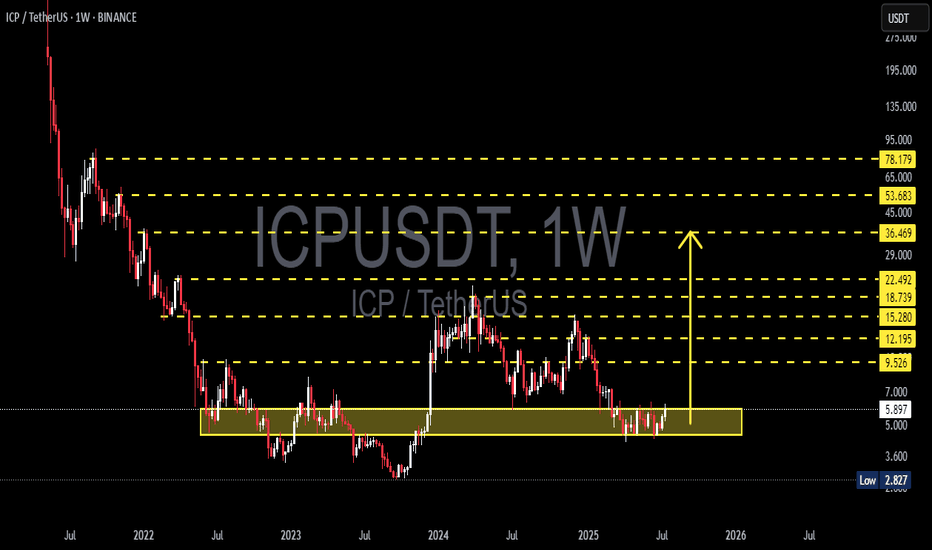
🔍 Macro Outlook & Context: ICP has been in a prolonged downtrend since its initial listing, dropping over 95% from its all-time high. However, since late 2022, ICP has been forming a strong and well-defined accumulation base between the $3.00 – $6.00 range. Currently, price action and structure indicate that a potential breakout from this multi-year base is...
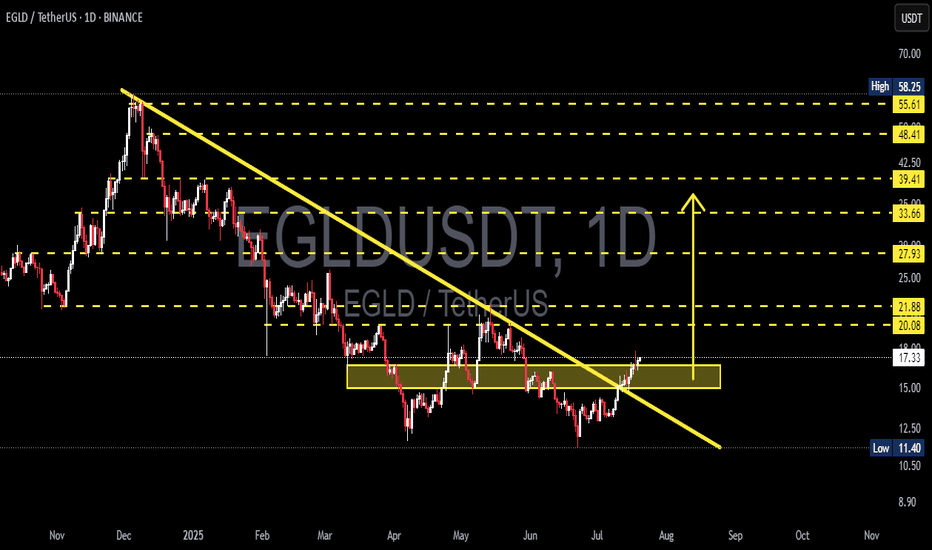
📊 Detailed Technical Analysis (Daily Timeframe): 🔍 1. Market Structure & Chart Pattern Major Downtrend Line Breakout – Reversal Signal: After being stuck under a persistent downtrend for nearly 9 months, EGLD has officially broken out of the descending trendline, signaling a potential shift from distribution to expansion phase. This breakout is significant and...
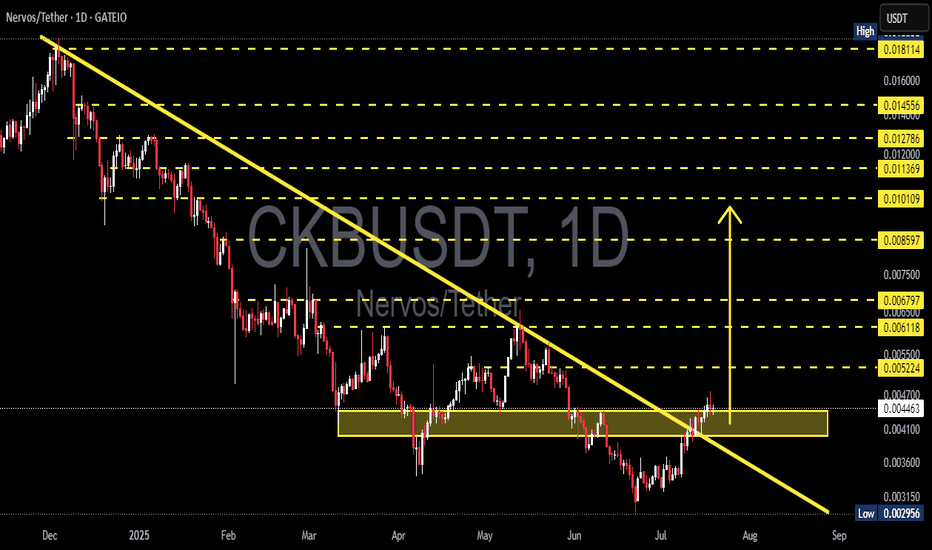
🧠 Technical Analysis Overview (1D Chart - Gate.io) CKB/USDT has officially broken out of a long-term descending trendline that has capped price action since late 2024. This breakout marks a potential trend reversal from a prolonged bearish market into a bullish phase. The breakout occurs alongside a key horizontal accumulation zone (highlighted in yellow),...
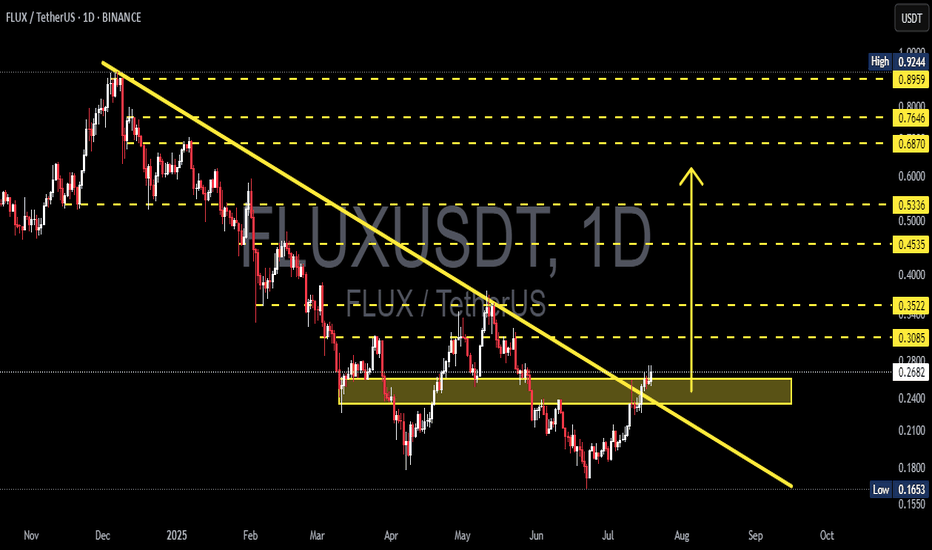
📊 Technical Analysis Overview (Daily Timeframe) After months of persistent downtrend pressure since late 2024, FLUX/USDT has finally flashed a high-probability bullish reversal signal. The recent breakout above a long-standing descending trendline may mark the beginning of a new bullish structure that could fuel an explosive upside move. 🔍 Market Structure &...
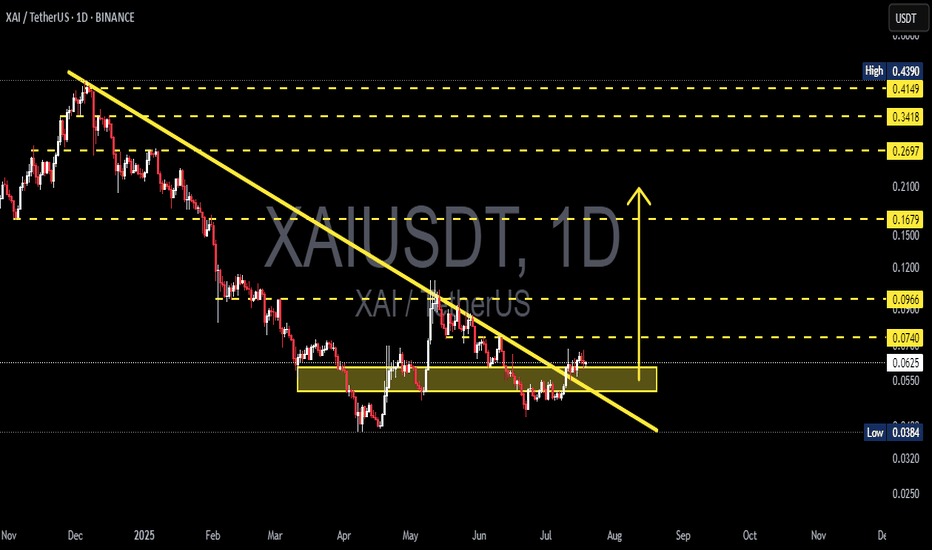
🔍 Complete Technical Analysis & Market Insight After months of downward pressure, XAI/USDT is finally showing significant signs of life. The pair has successfully broken out of a long-standing descending trendline that has capped price action since November 2024 — potentially marking the beginning of a new bullish phase. 📐 1. Pattern & Technical Structure: 🔸...
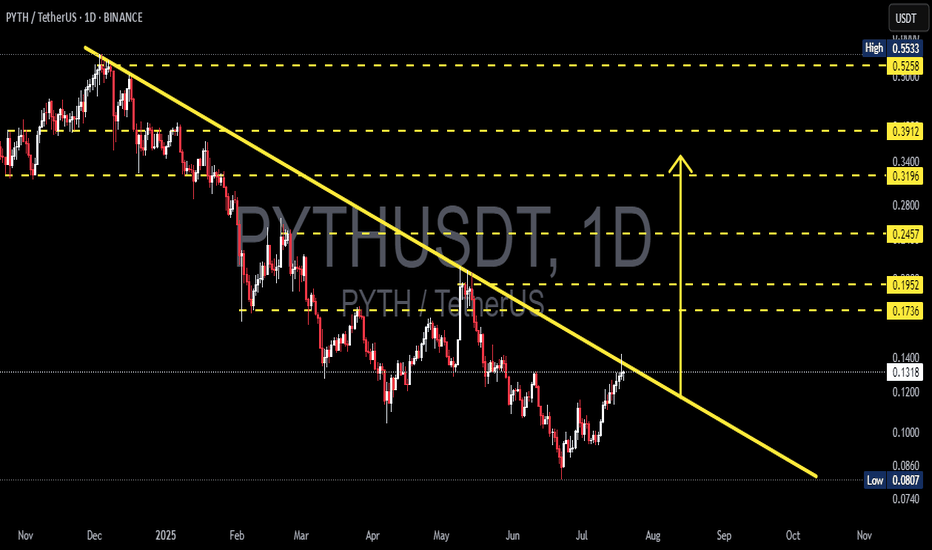
📌 Technical Overview: After nearly 8 months in a strong downtrend, PYTH/USDT is now showing signs of a potential trendline breakout. Price action is testing a critical descending resistance that has been respected since late 2024. This could be the turning point for a major trend reversal. 📉 Historical Context: PYTH reached a high of $0.55, followed by a...
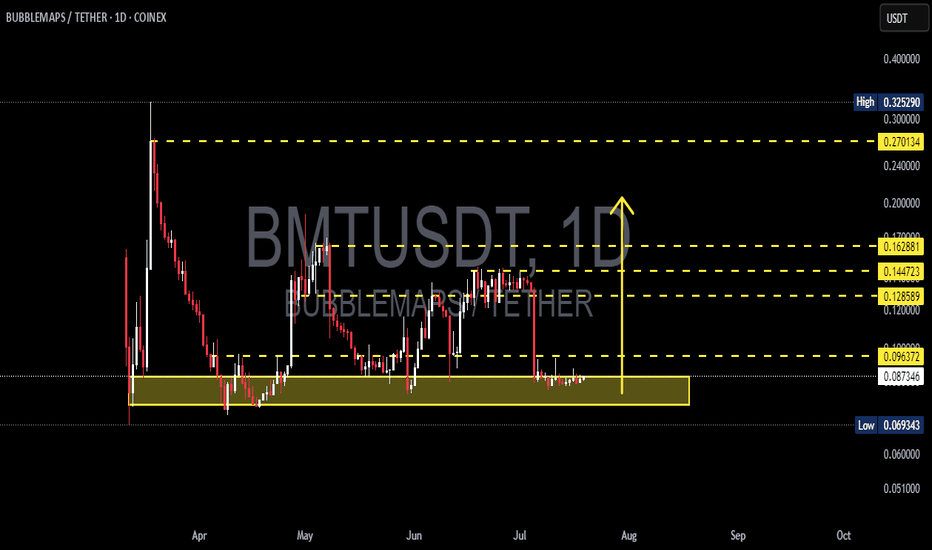
🧠 Complete and Insightful Technical Analysis: The daily chart of BMT/USDT reveals a compelling structure for traders looking to capitalize on early-stage reversals and bottom entries. The price is currently consolidating within a strong historical demand zone, ranging between $0.069 – $0.087 USDT — a level that has previously triggered multiple significant...
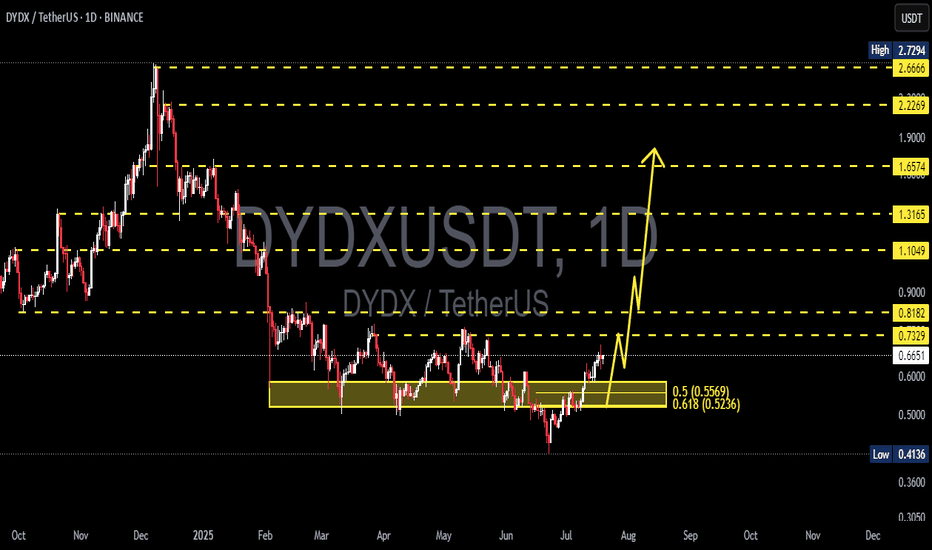
✨ Comprehensive and Engaging Technical Analysis: DYDX/USDT is entering a highly compelling technical phase, showing signs of a potential trend reversal after breaking out from a prolonged accumulation zone that lasted nearly 5 months. This breakout on the daily timeframe (1D) is a classic early signal for a major upward move — often favored by swing traders and...
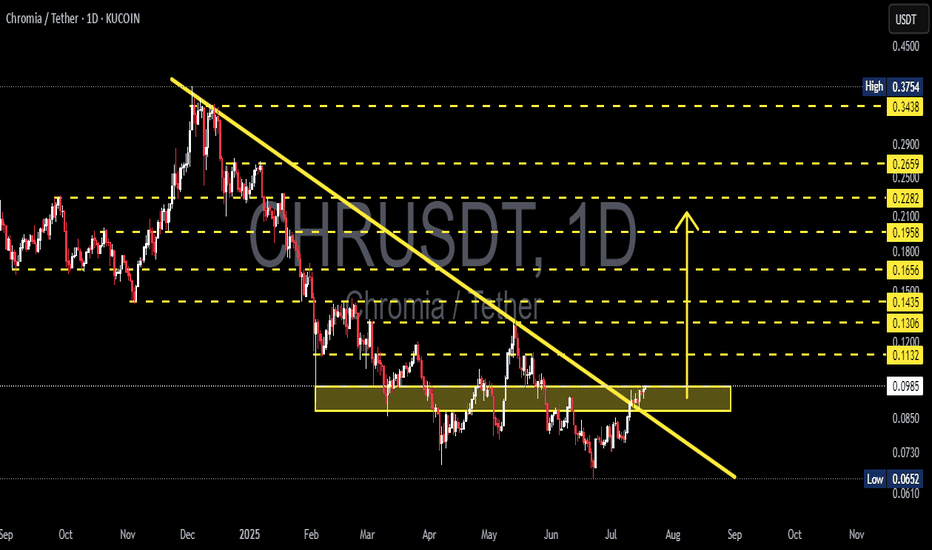
🧠 Complete Technical Analysis: After months of being trapped in a prolonged downtrend since December 2024, Chromia (CHR) has finally shown signs of awakening. The price has successfully broken out of a major descending trendline, while also breaching a critical consolidation resistance zone between $0.093–$0.098 (highlighted in yellow). This breakout not only...
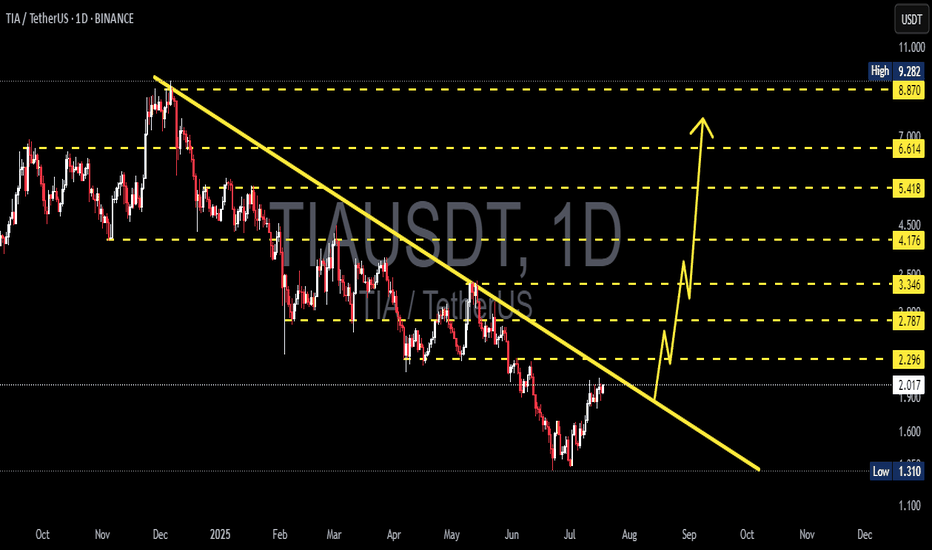
🔍 Full Technical Analysis (1D Timeframe): TIA/USDT is approaching a critical turning point after experiencing a strong downtrend since December 2024. The chart clearly forms a Falling Wedge pattern — a classic bullish reversal signal known for explosive breakouts when confirmed. Currently, the price is testing a key confluence zone around $2.00 – $2.30,...
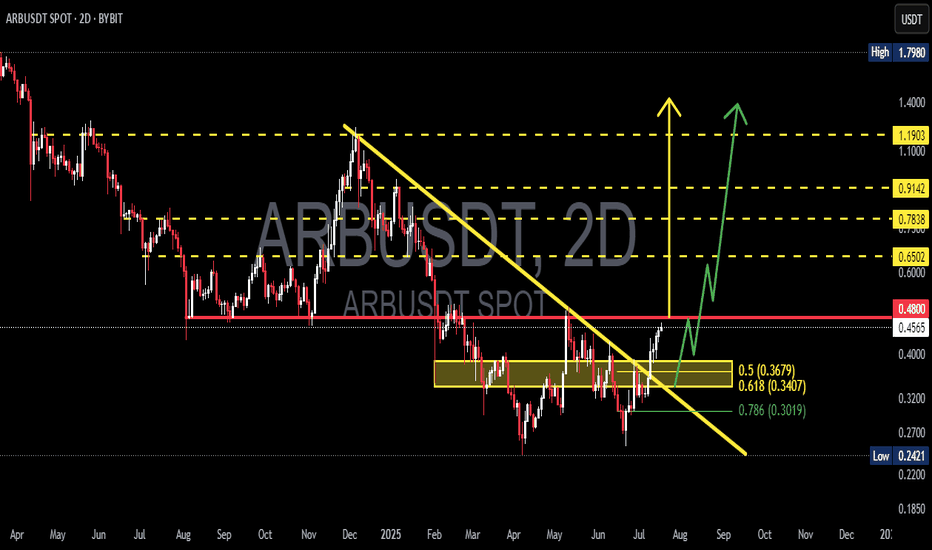
ARBUSDT has just completed one of its most critical technical phases in recent months — a clean breakout from a medium-term descending trendline that has been suppressing price since December 2024. 📌 Pattern and Price Structure Analysis: 🔹 Descending Trendline Breakout: After months of downward pressure, ARBUSDT has finally broken above a long-standing...
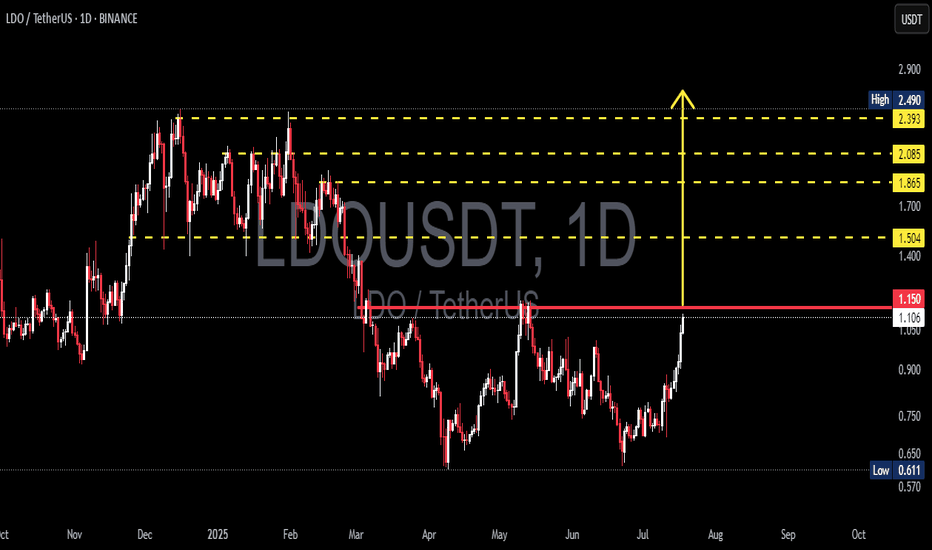
🔍 Full Technical Analysis After months of downtrend and tight consolidation, LDO/USDT is showing clear signs of a bullish resurgence. The breakout above the key psychological resistance at $1.15 opens up a wide path toward higher resistance zones, potentially marking the beginning of a strong upward trend. 📐 Key Pattern Formed: ✅ Double Bottom Pattern >...
