#BTC has been range-bound on the weekly , recently forming an SFP below the range low but failing to close below the Feb and Mar 10th lows. Could we see an SFP above the RH ($90K) before moving lower, potentially toward the FWB:65K -$72K target? That remains to be seen. The HTF MS remains bearish, and until it shifts, the risk to the downside is high. For a...
The BTC/XAU ratio is unusual but, imo, could add confluence to BTC’s PA. We often use majors like TOTAL, USDT.D, USDC.D, BTCUSD/USDT.D, BTC.D. ETH/BTC and BTC pairs to find confluence, so why not include this chart? 👉Why BTC/GOLD? It highlights BTC’s relative performance against a traditional safe-haven, helping confirm bullish or bearish trends when aligned...
We’ve finally hit our ultimate target of 6.1-6.2% (3-drive pattern ✅), which we first talked about back in March after taking the 5W/5D HOB at 5.3%. We said that as long as USDT.D stays above the 4.76% SL, 6.1-6.2% would be the next target - and here we are. We did see a very decent reaction from the level, as mentioned before. Scalp longs could’ve been taken,...
USDT.D has closed above PSH at 5.51%, which warrants caution. However, I’d like to wait for the weekly close to confirm the direction USDT.S is headed toward. That said, we’ve now taken the 5.6-5.7% level I mentioned last week in my idea, and this should provide enough liquidity to target downside levels. If we overshoot and wick, keep an eye on the 6.1-6.2% level...
DOGE is quickly approaching the 3D HOB at 0.12 and 2M Demand at 0.15, which would be a fantastic RR opportunity if in confluence with BTC and TOTAL. All the information, such as TP, short, and supply, is provided in the chart. Mark those key levels and keep an eye on them :)
Again, not an awful lot has changed since last week’s update. We’ve now closed a weekly candle yet again in no man’s land; in fact, one could argue it’s a bearish engulfing candle that closed below the previous week’s level, solidifying further bearish sentiment and likely continuation until key SH has been reclaimed. Like I mentioned in last week’s update - for...
Clear HTF distribution. There’s a potential pullback (if it occurs) into the 1W PHOB before a downward continuation. Personally, I’d like to get involved between the HTF Demand zone and the 1M PHOB + 4W HOB, which, in my opinion, could serve as a potential reversal level, so keep an 👀 out
#NEAR has created a BOS, followed by a drop into our POI, which has provided a nice 21% bounce. It’s a level where one can spot-buy NEAR. Personally, I’d only look for longs from the 3M HOB refined into MTF or the demand level just below it. Other info., such as TPs and entries, is provided in the chart. I’ve noticed that people usually miss Supply and Demand...
There’s a significant amount of liquidity between 2 & 2.5, specifically around the 21H HOB, which is located at 2.35–2.4. If that level is reached, it could provide a significant bounce; if it overshoots, we should look at the lower levels as shown in the image. It’s currently bouncing from the 7W HOB, but I’m particularly interested in that 21H HOB. Let’s see...
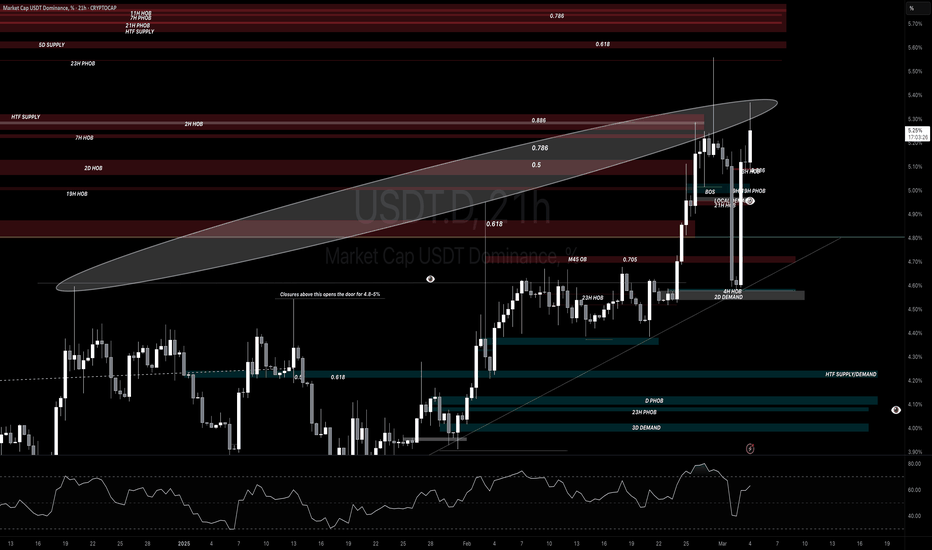
#USDT.D closed the daily above the PSL at 5% after bouncing from the 2D Demand level + 4H HOB located at 4.58%. The upside liquidity sitting at 5.6%-5.7% will likely be taken, which will likely coincide with 77K or potentially 72K BTC & 1900-1700 for $ETH. It could reject from the current liquidity block at 5.3%, but because we closed above 5% again, the...


