Cryptoffee
If you never drew the Fibs on a logarithmic chart - give it a try. Nothing is certain. I am just giving you different perspective.
Nothing changed since my last analysis. IP2 has nearly formed. Upward target from here is minimum at 50% Fib. Further up at 61.8%. This pattern will become invalid if BTC fall below $7,700 or 0% of the retracement. I identified a very tight cluster formed of X/A/A1 extension and X1/A1 retracement. This indicate strong resistance on both levels. For those...
Possible internal pattern forming with target at 50% Fib. This pattern will be invalid if BTC fall below $7,700.
I would not be surprised if Bitcoin will get well deserve break in this uptrend. Taking on the account the past symmetry (blue) a similar pattern would emerge from this point. Possible retrace to the $5,100-$5,200 area would be very healthy. Moreover, so far 1.272 is acting as a resistance. If Bitcoin will pass that, then 1.618 at $6,000 level should also be on...
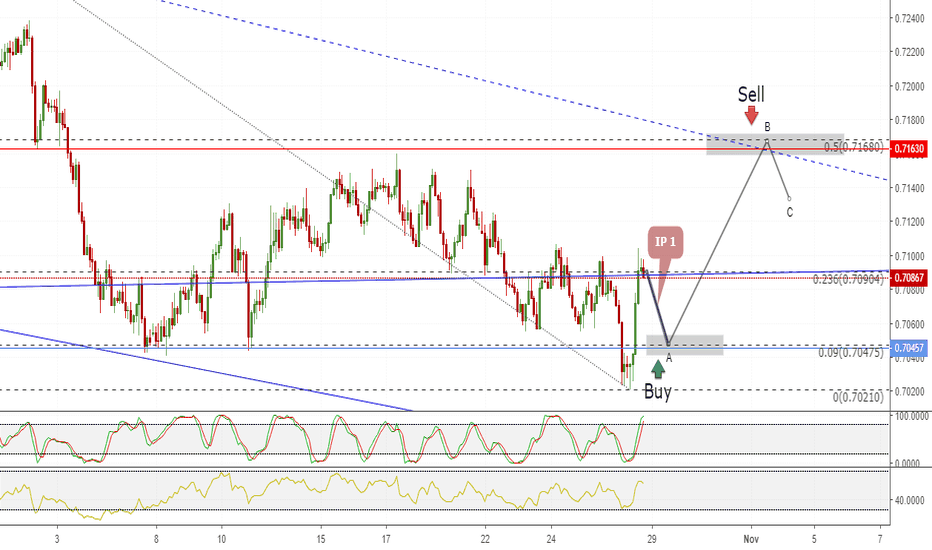
Looking at the STOCH and RSI, there is possibility for a small reverse downwards, which could form an internal pattern (IP1). If so, then a long position could be open. SL should be placed right below 0% Fib level. TP at 50% Fib. Ps. This is not a financial advice. It is purely based on my approach to the market.


