DaddySawbucks
After a shallow brief wave 4 now in progress expect higher again for a week or ten days. Wave could carry Dow back to Jan high or perhaps a bit shy. Should get within 2 percent. By early to mid-September we could see Dow reach a new alltime high, although it has lagged Sand P and Nasdaq is a real bubble. Market was forming a smallish wave 4 when the Donald...
1.618 Fibonacci extension line on the Bearish Gartley pattern intersects the high trendline, Demark pivot resistance and completes the Gartley pattern at 26268. Look out for the usual patterns- shooting stars, Pin Bar, H&S if we get them as clues. None to be seen anywhere 8/27 all day so it's probably going higher. Just a best guess. Good luck! This post for...
Reasonably confident these wave counts are accurate. It's more art than science. Look at Mark Rivest's counts , he is even more optimistic than I am: We've got a triple combo 5-V-v wave forming off the shallow 4th wave last week. My Fibo projection for the last stage of the rally is 2937, but it could blow through that easily, won't be surprised to see it over...
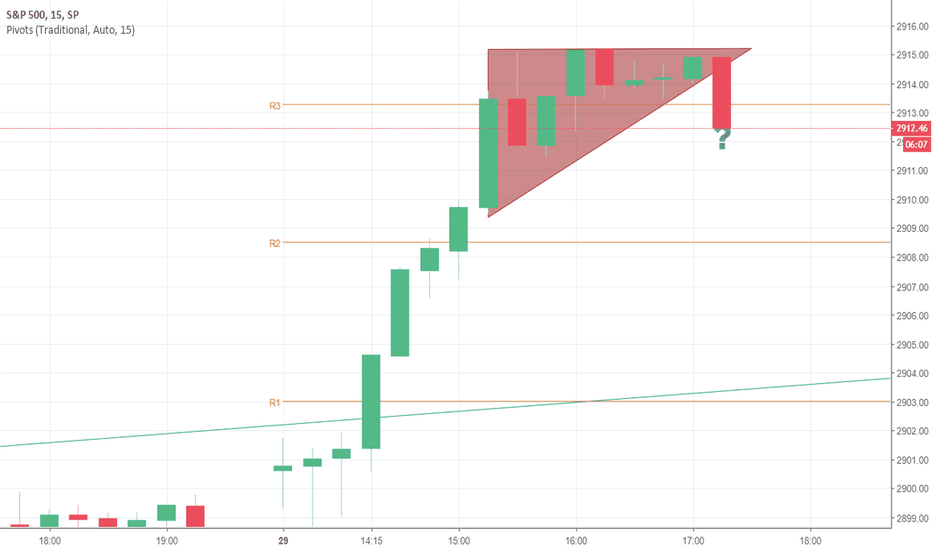
Reached 2903.77; precalled 2903.5 the night prior. Pretty snug fit- right at trendline. Expect some pullback to fill the gap up from 2875 and possibly to lower S1 support at 2862. I would be be cautious for Bear Traps, don't get caught in the pivots! Good luck- This is not investment advice it's purely an educational post, enjoy!
Going down! I shorted at 2873...
Demark pivot R1 at 2907. High trendline intersection in bear (bull?!) flag at 2903. Bullish algos- can they drive it through resistance to break up? Now we have a double-double top and three drives to the top. Have been fooled before but this sure looks overbought. Maybe going to the Moon... or headed for a timely pivot reversal. As always this is not...
US 30 traded below Tuesday high of 25888, closing 98 points lower than 8/21 high, failing to confirm Sand P new alltime high on 8/24. The zig-zag pattern is evident on chart. I marked this one as a more complex ABC structure as a 5 wave reaction (ABCDE) is evident in A wave. Combined with bearish Gartley pattern confirmed 8/21, this latest rally attempt looks...
Folks, We got blindsided by a surprise bull run Friday 8/24 which seemed so unlikely I was horrified and amazed all at once. In retrospect, some sort of rally was to be expected off the Thursday low prices, and I hedged my bets in case, but this was quite bullish indeed. In spite of making a new high closing price on Sand P, US 30 did not confirm the high...
Compare to 6/14 Harami cross. Identical price behavior 8/21-23 c/w 6/12-14 and 8/7-9. Slapped down hard from high channel retest after 8/21 high. All the Doji have been seen- pin bar, shooting stars, Harami crosses, engulfing bears, Red Shooting star today. Perfect setup for lower and soon- imminent. Today I observed a bear flag all afternoon following the...
Going down soon- look out! This for education only is not advice!
Looks like a double top formation with H&S filling in live now. Expect lower end of day and into next week. Good luck! This is not investment advice and Im not advising anything, all posts for education only.
Expect gap down and significantly lower based on very bearish futures in PM. C wave beginning- soon. It might be very strong b/c it's a combo of primary ABC from Feb cycle and an intermediate ABC coming off the June swoon, both waves terminating at this juncture. Possible low target zone 23531 at Nov/Dec 2017 support. Good luck! As always, this is not investment...
Compare/contrast to 11/12 June top and throwover. Bearish engulfing candle. Shooting stars. On intraday we saw hanging man twice, and shooting star in SPX 8/.21. Expect imminent throwover to entry on wave C of ABC ZigZag correction pattern within days, after reaching all-time high on SPX 8/21, US 30 25888 at Fibo 0.786 from Jan 26 high. Target 23531. Possibly...
For months I have struggled to make Elliott wave theory fit this Bear Flag rising channel but although 5 wave impulses appear within the channel, it is not itself a motive impulse, but rather, it is a complex, 7 or 9 multi-wave zig-zag flat corrective pattern "A-B-C". It also contains WXY components which we recently observed press index under 25000, as well as...
Traders, my bearish colleagues have persuaded me to take a second look at this channel flag. What I found is beary scary. For months now US 30 have been in correction charting a rising channel. My alternate Elliott wave analysis suggests this is an ABC large-scale correction and the Bear Flag is a long, strong B wave, nearing completion in August. For the...
Extreme bullishness prevails. Vix- dropping off to almost nothing. What looks like a tiny Elliott wave 2 formed Friday AM but quickly dissolved into bullish enthusiasm. If this is the breakout move gathering strength, then the chart shows a possible course. I believe we may have entered minor wave 3 of the V(v) 5th wave already ('third-in-fifth wave'). I lost...
Dow has charted a hammer spike candle formation with massive reaction after. Hope you got to play that round from earlier posts! Now comes critical test time- breakout or fakeout? Failure to break channel upper trendline will lead to a precipitous decline- panic selling. Gann fan shows of the prior breakout attempts from the flag channel, in April/May and...


