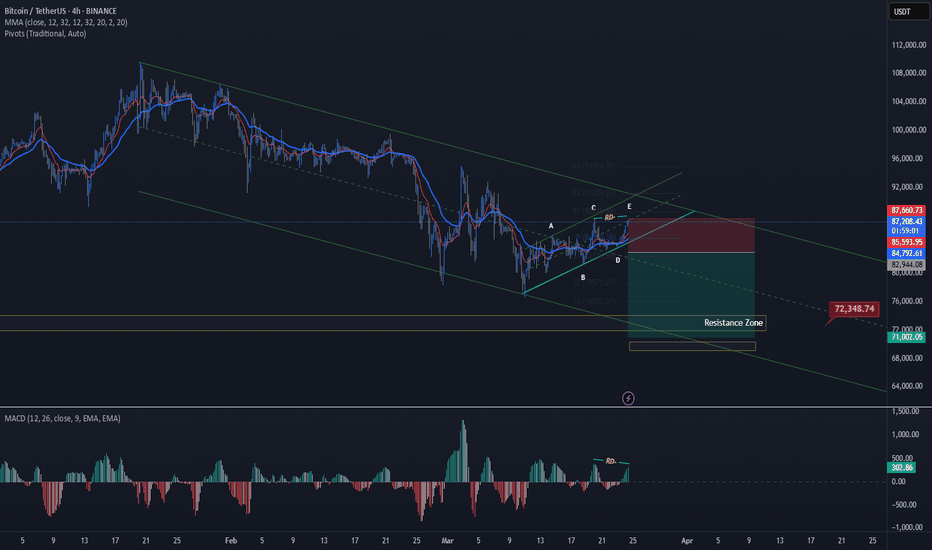
Currently, BINANCE:BTCUSD the price prints a bearish flag on the 1H chart and a descending channel on the 4H chart. As long as Bitcoin is inside this descending channel, we have to stay bearish and trade with the trend until the end. This bear flag is also a problem because you would rather not see such patterns in a bull market in general. My next target is...
COINBASE:BTCUSD wave III has been completed recently and I think Wave IV is loading....... What do you think?
📈 On this Daily BINANCE:SOLUSDT SOLUSDT chart, we view the data on a logarithmic scale. Crypto assets often grow in an exponential way, so a log chart can give a clearer picture of their trend. 💡 When you catch a trend, move with it. That’s simple!
COINBASE:BTCUSD It is possible that Bitcoin is forming a butterfly pattern as a completion of the 5th Elliott wave. In this case, it is possible to make corrections as shown in the picture by completing this model. Since the financial markets are under the pressure of many factors and any factor can cause fluctuations in it, the provided analyzes are provided...
Possible senario for Bitcoin could be completing a Crab Harmonic Pattern which is compatible with Wave III PRZ of a Elliott Waves Pack. then Break out the level $65,700 to $62,385 What do you think?
OANDA:EURAUD has been completed a BAT Harmonic Pattern. I assume the pair will make a correction and we are looking for a Short Hunt
The confluence of the Shark Harmonic Pattern and the Elliott Wave Theory can provide strong signals for potential market reversals. By carefully analyzing the Fibonacci ratios, wave counts, and market behavior, you can create a robust trading strategy. Always complement pattern analysis with other technical indicators and sound risk management practices to enhance...
By examining the trend in the one-hour time frame of OANDA:XAUUSD , in addition to breaking the bearish angle pattern, it now seems to be forming and completing the RISING FLAG pattern, and therefore, on the condition that no one-hour close candlestick is recorded below the interval. An important support in the range of 2304-2298, the rate can increase by...
If the Shark Harmonic Pattern wants to act normal, the price should be reach to TP Shark as DeepCrab did few days ago.
OANDA:AUDJPY Gartley Harmonic Pattern has just completed and assumed to fall down
FX:GBPUSD 📣 Examining the pattern of the trend shows that the price movements are developing within the range of the drawn neutral channel. Breaking out of the ceiling range of this channel, which is at the level of 1.2692 - 1.2718, requires fundamental data that will give the dollar a bearish direction. 📣 The ceiling established on February 22, has been created...
FX:USDCAD After Completing Shark Harmonic Patter, USDCAD might retest the support zone again.
OANDA:XAUUSD Gold is moving above the EMA200 and EMA50 in its descending channel on its 4-hour timeframe. If OANDA:XAUUSD correct to the range, which is at the intersection with the bottom of the upward channel of the one-hour time frame, we can expect upward fluctuations in gold with a better reward. Considering the good bullish momentum of Gold, the intention...
FX:GBPUSD In the 4 Hr timeframe, the price is jumped off the range of the Bollinger bands. For this week, the level of 1.2580 - 1.2554 plays the role of key support, so as long as it stays above this level, the continuation of the growth up to the level of 1.2742-1.2745 has a high probability.
FX:GBPUSD A continuation of the downward trend within the established descending channel still seems likely, but today a key support level is located on the way to the continuation of the price decline. This key level is located in the price range of 1.2675-1.2668, and a 30 min close below 1.2675 will confirm the continuation of the price drop to the levels of...
OANDA:XAUUSD This week the price level of $2040-$2045 will play a key role because the persistence of the price below it will increase the possibility of further decline to the levels of $2012 and $1992.
BINANCE:BTCUSD Bitcoin is above EMA50 and EMA200 and is trading in its one-hour channel. It should be seen how the above candle will be closed. Bitcoin remains below the $44,000 resistance at the moment and has been unable to break it. If this range is crossed, we can expect Bitcoin to reach the $45,000 level, which is also at the intersection with the midline of...
FX:GBPNZD is waiting for a retest, then a bullish price action candle from the demand zone to confirm the rise again📈, and the analysis ends with any direct daily close below the zone. ⚡️ Good luck, guys.🙌🙏


