Sol has made two massive pushes to the upside this cycle followed by a long distribution / re accumulation range. We have not quite seen a full 1/3 retrace of the cycle low but certainly in range to be watching for a momentum shift signaling seller exaustion and new intrest at the lower prices. Current Trading Plan: DCA until a clear momentum shift occurs and...
After a common ABC retrace into the 50-61.8% area since its last low prices are approaching its trend line. FET has already seen major gains this cycle along with the merger of agix and ocean. Current Trading Plan Begin to re accumulate and watch crypto market as a whole for potentialy one more push to the upside this cycle.
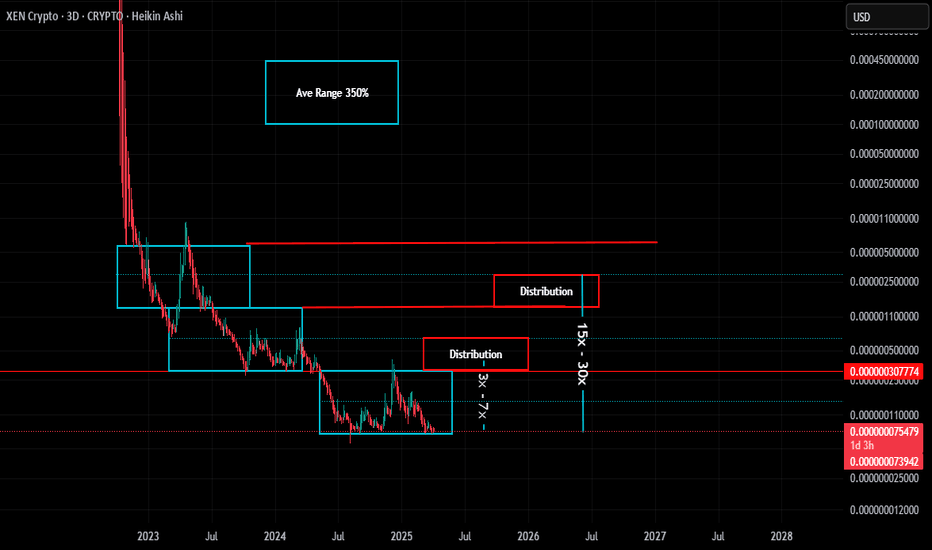
Xen is a project I have followed since launch and have always seen value in the team that created it. Mostly in th credentials of the creators, ability to produce numerous projects shows ability, interest, and drive to create. Next on the list is the layer one block chain x1. Not sure on the timeline or if it will ever exisit but still highly interested in this...
I see no real value in hex of any kind. With that said hex had Richard Heart. Regardless of opinions of Richard his efforts certainly built a massive following and interest in the project. If at some point in this potential bottom territory if Richards lawsuits were to settle positively and restarts his live streaming and constant promotion efforts.... well he...
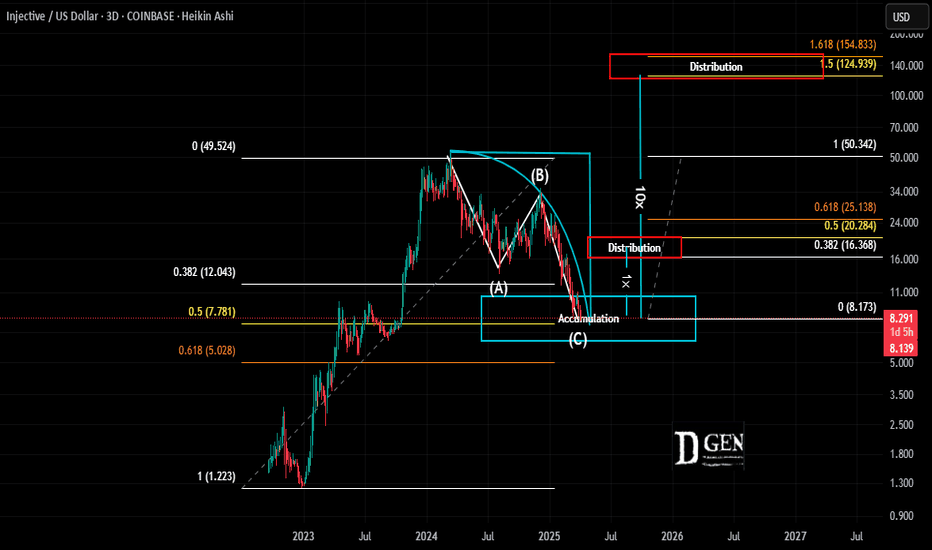
INJ is another crypto project that seen massive interest and price rise straight out of the bear market. Now we see it has completed a very typical retrace pattern and percentage. Since reaching its all time high it has completed a standard ABC retrace of 50% of its low. Current Trading Plan: Re-accumulate and look for another major rise in price. Risk at...
It has been a while since taking much interest in our favorite crypto projects. After massive gains straight out of the bear market most of that interest has sold off. Previously we were targeting the 5 cent range and appear to be getting very close. Current Trading Plan: Looking at proportional relationships in the price chart to gauge potential moves we can...
This is a logarithmic daily line chart of solana. The logarithmic chart function is used to show the relationship of percentage change rather than just showing the change in dollar amount. Nobody cares if a $100 asset goes up by $1.00 but they definately care if a HKEX:2 asset goes up by one dollar. It is for this reason we use the log function as it is the...
Crypto has been trading sideways for months. We have seen some significant retraces with plenty of upside available without even braking previous highs. This is a daily chart and looking at the time aspect of our gann box there is near perfect proportions with each pull back and now reaching the end of the projected cycle. Looking at the wave trend oscillator...
Since hitting its high in March around 75k BTC has been trapped in a megaphone consolidation pattern. Locally we have been trapped between 49k and 70k. There is no way to know if the pattern will continue but the longer it goes on the more likely it is to brake. Current trading plan is to stick to the short side until the pattern brakes showing a clear sign...
Eth is a staple to the crypto industry and doesn't require much analysis to assume up and to the right... The question is when and where. Currently looking at the weely chart we can see out wave trend oscillator is showing momentum to the down side is slowing as price has come down to out main up trend and the last major support resistance flip. Current trading...
CFX has been on our short list of big movers as its recovery in the bear market was among the highest gainers at a 25x. A clear sign of major support off a bear market bottom. Price has since put in a higher low, higher high, and now a 100% retrace for a potential double bottom. Just sounds bullish... In this same green range this double bottom is also the...
After a sufficient pull back into the golden zone of around 62% on this weekly line chart we see big mover INJ has been losing down ward momentum into major volume base support. Looking at our weekly lows we can see nice curvature showing momentum slowing to zero and our wave trend oscillator is right in the time period we should be looking for upward...
Presently BTC is sitting in a period where neutral seems to be the best outlook and bullish on the short term. Looking at the wave trend oscillator we can see the momentum waves are rotating to the upside. We have seen price make decent push back to the upside but is presently stuck at the value area low. IF there is more downside potential as shown in our last...
It has been a while since taking any serious interest in crypto as things cool off. Enough time, enough discount, new interest... This is a weekly line chart of FET. Looking at the price action there has already been a typical but always hated 50% pull back to the lows. This 50% pull back magically aligns with its last major broken resistance for a hopefull...
If you have been with us for a while you know I have been looking for a pause or reversal in the trend at this time since June of last year. We have reached that time period, price has not broken higher and finding collection of things that leading my personal bias to a reversal or significant pull back. IF this is what we see I don't expect a straight shot...
This is logarithmic BTC chart with Weekly candles showing the pretty consistent market timing trend with near perfection. If there is another BTC mega run to be had and BTC continues to follow the same cycle it has 3 times already the ride to the top typically has more sideways dip action before a real brake out occurs. At the same time 3 repeating bull cycles...
Crypto markets have had some time to cool off and most assets have formed what is HOPEFULLY reaccumulation ranges. This is a daily chart for INJ. Price has pulled back to the macro trend line, broken structure to the upside, pulled back 50% and appears to be finding support following the momentum curve. Potential Targets: An ABC mearsured move target aligns...
Looking at the xen chart we approaching a time cycle where a piviot would be likely. Being we are still in a sideways accumulation range there is a potential for a trend change to the upside. This is daily chart and since the potential bottom while ranging it is still making higher highs and higher lows. Current push down to the bottom of the range and rounding...


