Haven't been a fan of financials in longer than forever. Now nor even back in December would I have bought any of the financials - esp since most of the setups were just too broken/ugly. Sexy ass candle though, surprised I got to this one right after first candle to see a breakout lmao. Solid upside potential long term after this little triangle breakout though....
Two ATH's & a -20% bear market well within a full trading year - definitely one for the books. Outperformance of tech recently is as obvious as it was last year when $NDX was first major indice to get back to new ATH's. Either an A+ time to get short or just the start of another overly-bullish type phase to clone 2018
For me, and only using 2018 as a reference - the financials have 100% been a leading indicator for the market. If you don't agree - you can peep my $GS post from August 2018 because there really isn't an argument. Seeing as each chart I've looked at has just about the same correlated pattern - just decided to post the one with the best R/R. Without even...
Lemme get this in before the day starts because realistically - if you're short, save yourself the time and either hedge or just get long and stop being so fucking annoying. A long time I went with either getting burned while everyone was bullish - & it's just ironic how sentiment is probably the biggest lagging indicator in the market to be used as a "helping...
As difficult as it's been to even find something worth getting long on - it was easy deciding once I saw this chart. I'm not emotional when it comes to a nice/ugly looking chart - so I couldn't tell you when earnings is nor what's going on in the company internally but for the time being - there's plenty of room to run on this. Feel like I found it in a perfect...
Typically, I leave the technical explanation for last when I post an idea. Mainly because there's always a different perspective of TA with the bias of someone's bullishness / bearishness on the market, but also because it'd be a waste of space to type out my own TA for each chart since....... it's the same for every chart lmao. THE most accurate charts I've...
Idc if this mf surges to $375 tomorrow for earnings - yellow line is your line in the sand. NOT shorting until we reach that yellow line my guy
Calling the top for this one. Healthy rally in an unhealthy trend. But a spot on-crystal clear type of top pattern I'd definitely recommend getting in on anywhere within the $105-$106 range. Anything above the first resistance trend-line I'd be somewhat quick to let a stop loss run its course.
You know back in September I felt crazy for feeling crazy for calling the tippy top of the market on a specific day (literally. 25th, check $GS post). I knew the reaction to a post-market "correction" (-1% away from bear market but who's counting) would pretty much define the rest of the process. To be bullish NOW is as risky as being bullish back in September. &...
You know after this past week's rally - I was more than surprised to see it be led by financials. I'm more bearish on the financial sector than I am every other sector combined. Even without the bias - everyone has a "dip" they can justify buying regardless of the PL it makes - typically, when one sector makes a new 52 week low 3 times within the past 4 months -...
Son there's something up w/ the market with the types of charts I'm seeing. I wouldn't consider getting long on SHIT until after today. 6 months I've gone without seeing any familiar setup that gets chewed up & flushed out just to stage a fake rally but - there must be some type of life in the market if I find 3 breakout ready ass setups without even trying to...
My $AAPL posts tend to be 40/60 (not in my favor) - but this one is a bit more simple. The 20-50-200 "death cross" to me is over-rated, because in a market as bullish as this one has been, there's too many speculators that seem determined to keep price above certain levels to avoid the most overly-used technical indicators to meet. With the exception of 2006,...
0% DD on this company at all - no idea what sector it even belongs to. Either this chart is sexy as fuck or I'm boutta be A-ok losing alotta $. Yellow line marks a big move, (I'd say up but, could go either way) - $92 PT
MY FUCKING MANS, IF THIS ISN'T THE BOTTOM THEN I"M STILL COOL WITH TAKING THE DISCOUNT @ $115. NO OTHER COMPANY IN FAANG IS AS PROFITABLE WITH THE ABILITY TO FUCKING PRINT CASH WITH SUCH A MINISCULE AMOUNT OF DEBT. IDK JUST ME THO I'M ONLY 5/5 ON FB CHARTS
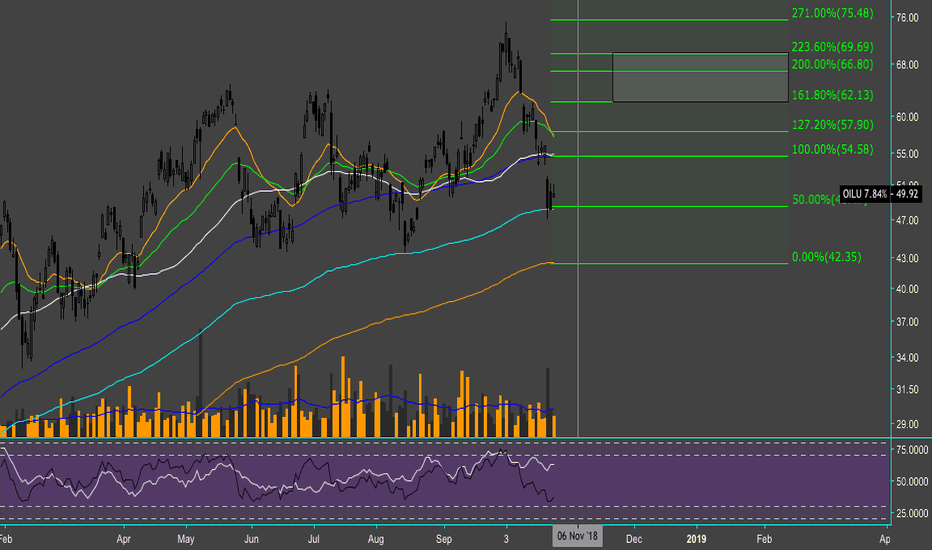
No need for technical explanation. 200% - 223% fib ($56.$58) A1 target price.
If you like taking candy from a baby - this one's for you. $CRMT earnings this week could put a dent in a new 52 week low - we'll see how the rest of auto-dealerships hold up though. Could get interesting
DUMB excited I actually found something I could get long on & not have to worry about sitting on it. I'm one of (maybe a handful?) of people that will actually describe how/why oil has the potential to see $100 (more-or-less, but potentially more) a barrel. This one is interesting, so it deserves a lecture. To start, the price of oil is less of a market...


