For those of you who have been following my ideas, and I don’t think that would be many - understandably so, because these ideas seem so outrageous and out of the norm - I feel obligated to provide updated numbers per my own personal trade ideas. I expect BTC to flash crash. In summary, here is why: 1. DXY is breaking down and retesting a major bearish...
ETH on the multi day time frame appears to have been respecting this ascending series of support / resistances since its inception. If this resistance holds, this is a major breakdown of ETH’s last support - assuming the chart does work best on these ascending channels (certainly has historically). Due to this I am shorting ETH at 2550 appx - and my targets...
How low can we go? We will find out. Three bearish intersecting trendlines above. Short began initiating from above as per my previous post. I personally am not ruling out a flash crash to 10,000. DXY is breaking down a major bearish trendline on the weekly / monthly - Market has a prime opportunity to manipulate Bitcoin into all of these long stop losses...
Per my second last post about this red trendline - be mindful that there is a resistance located 109,800 to 110,000 zone. Although Bitcoin can break above, that doesn’t mean the resistance is invalid. Price will weave above and below until it sticks and plays out. Personally I watch these levels for sudden fast movement and confirmation that it’s holding as...
Bitcoin has shown strength towards playing out these ideas, as unrealistic as it may seem. The interactions at specific levels have shown these trendlines to be valid. I see two scenarios if BTC holds below its resistance at 104,550 to 105,000 104,600 to 35,000 35,000 retrace to 75,000 75,000 to 7,000 Alternatively: 104,600 to 20,000 Up from...
Here I present my second alternative for a Bearish case for Bitcoin. Per my previous posts I explain in detail the interest in recollecting liquidity in these lower zones. Previously I presented pathways to the uber lows at 7,000-10,000 - however this is another possible case. I believe Bitcoin can see a drop from 109,200 straight down to 19,000-20,000 Why?...
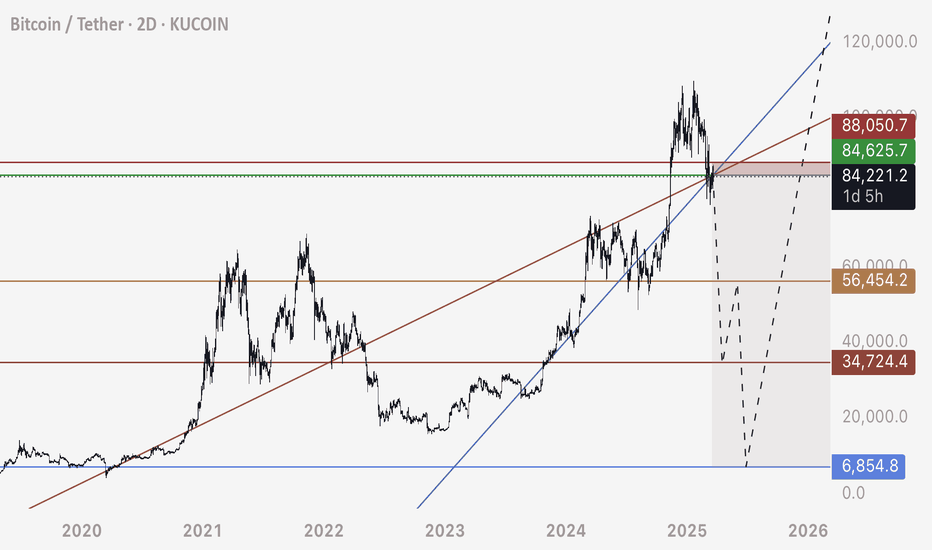
Zooming out on BTC chart we can note this major bearish trendline on the HTF. This diagonal support / resistance line can take BTC to 7,000. Likely? Maybe not. Possible? Absolutely. A straight move up on BTC like we have seen the last two years is very dangerous. There is a large chain reaction of leveraged sell orders via long position stop losses cascading...
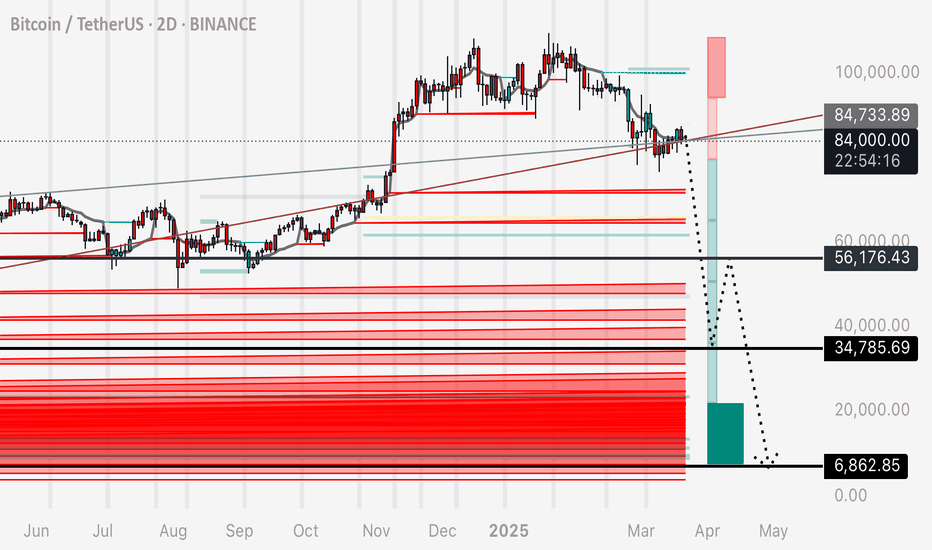
As a part II to my previous post on “Bull Market OR Bearish Retest?” - Here is a 2 day liquidity map on BTC’s chart. I’m anticipating a sharp drop to 7,000 - why is this number significant? There is a mass amount of liquidity in the chart down towards 7,000-10,000. This liquidity is in the form of long stop loss orders. In layman’s terms - the sell orders...
Bitcoins excessive rise for the previous two years brings concern for the mechanics of this market. Moving only up for so long leaves much liquidity in the form of long position stop losses below the current price. These stop loss orders, or leveraged sell orders, are an explosive chain reaction ready to set off. Observe these two trendlines and copy them to...
Bitcoin is back underneath these two intersecting bearish trendlines. I have laid out two potential paths Bitcoin could take to play this out. When an asset in crypto goes only up for so long, it leaves behind a trail of leveraged liquidity in the form of stop losses. These wide open gaps filled with long stop losses, is the fuel that would make such a move...
Further to my previous recent post, I wanted to highlight two indicators that accurately present us with liquidity on the BTC chart. Connecting the pieces of the puzzle of this prediction - this ABC correction pattern allows the market to absorb the Long position liquidity left in tact on the chart. Since these long positions leave a trail of leveraged sell...
I encourage you guys to draw these trendlines on your chart and experiment by doing some exercises. 1. Draw the main two trendlines. 2. Spend time on each by duplicating it, keeping the angle the same, and moving it to different spots on the chart. Notice how Bitcoin works on this ascending diagonal support resistance structure. You’ll find that the correct...
The FOMC data this week could be a conduit that sticks the price to play down these two trend lines. We can see the mass liquidity on the chart in these low zones. Bitcoins consistent rise since late 2022 has been leaving a train of long stop loss orders (leveraged sell orders) underneath - think of the mechanics of “why it’s possible” as a massive chain...
Bitcoin is back underneath these trendlines. Showing confluence with liquidity in the chart on higher time frames. Be mindful of this correction pattern.
Expanding on my last idea focusing on the first move in this sequence, here is a bigger picture of this idea and I will explain in detail how I arrive to this. 1. The market is always going to absorb liquidity. We know this. We also know that since Dec 2022 Bitcoin has been on a steady climb up allowing for lots of long positions to open and stay open. What...
I’ve drawn the main trendline and marked the contact points in red circles if you’d like to replicate this on your own chart I’ve also demonstrated that when the correct trendline is identified, it can be duplicated and placed at different points on the chart that price seems to follow - IE support / resistance works on a diagonal grid I’ve marked my personal...
It’s of my opinion that Bitcoin has a lot of interest in recollecting this long position liquidity. Per my previous posts we have some trendlines to support these zones being hit. Likely? Who am I to have an opinion on that. The facts are that there is a mass amount of liquidity here and technical analysis patterns that support price reaching those zones....
Sure it’s just two lines but they are lines that are repeatable and respected very well. Bitcoin dropping to these lows makes sense, the market wants it to happen, Entry is perfect currently at 104,000


