Discombobulate1
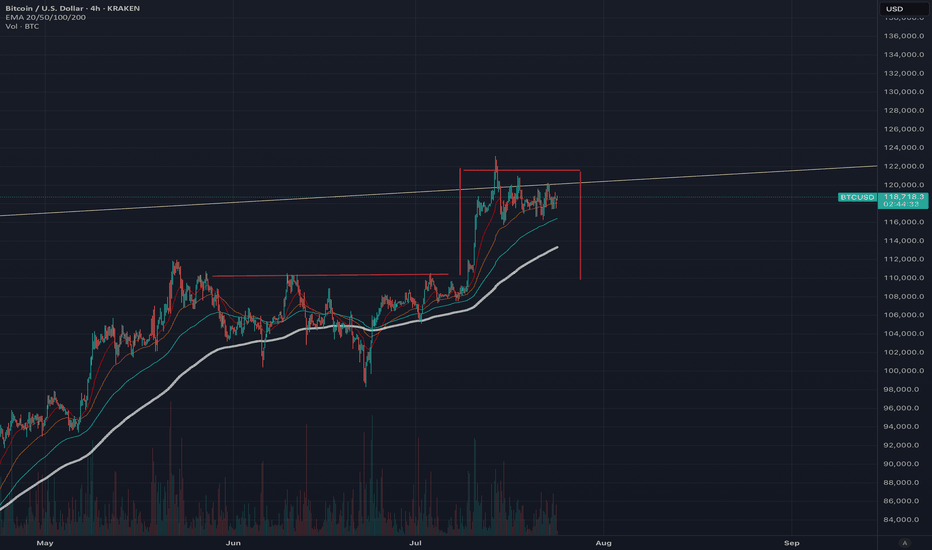
EssentialA possible Bart Simpson pattern is forming, which typically indicates a market top and reversal, with a retest of <$109,000 very likely. This pattern could also create a bearish head and shoulders formation, strongly suggesting a near-term top. Trading volume continues to decrease, and ETF inflows are now negative, with an increasing volume of BTC on exchanges...
Apple has significantly underperformed compared to the other Magnificent 7 stocks, but I don’t believe it’s a company you should bet against in the current climate. With a slow rollout of AI and recent statements from Apple, they may not always be first to market, but they generally execute well. The remarks regarding Sony, Samsung, and Netflix by Apple were very...
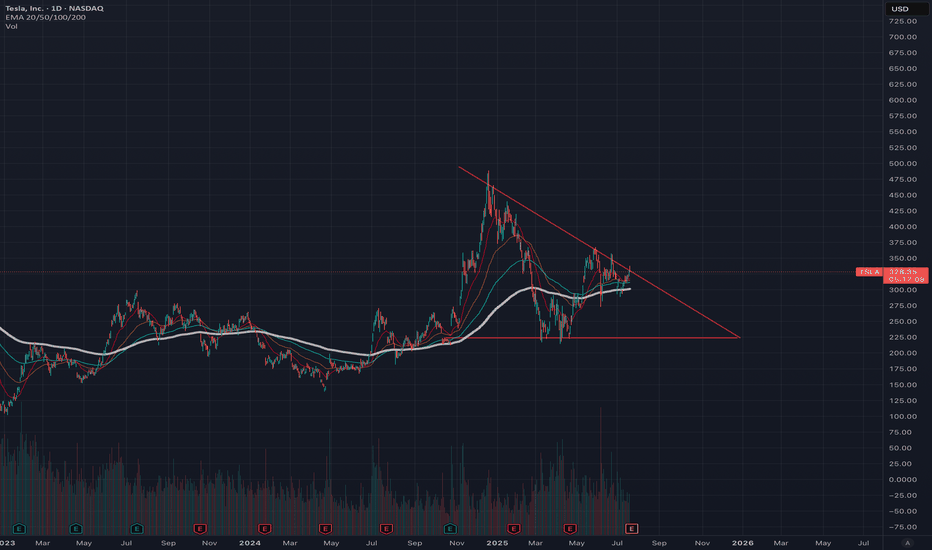
All the recent news regarding Tesla has severely impacted stock confidence. While Tesla's development pipeline appears strong in the short and long term, Elon Musk's politically divisive antics have been difficult to ignore. The EU and the UK, in particular, have been very critical of the CEO and his behavior, causing tensions and reluctance to support Tesla...
A reversal seems likely, so we should anticipate a pullback. The trading volume is decreasing while exchange volume is increasing, which suggests a potential market top based on previous trends. Greed is also on the rise. Although history doesn’t repeat itself, it certainly shows similarities. The BTC/GBP chart is indicating a double top pattern on the daily...
Is it time to sell? In percentage terms, MicroStrategy has significantly outperformed its underlying asset, Bitcoin. It's concerning to watch Michael Saylor's FOMO (fear of missing out) into Bitcoin over the past year, as this could ultimately do more harm than good for Bitcoin. MicroStrategy's stock seems massively overvalued compared to its Bitcoin holdings. As...
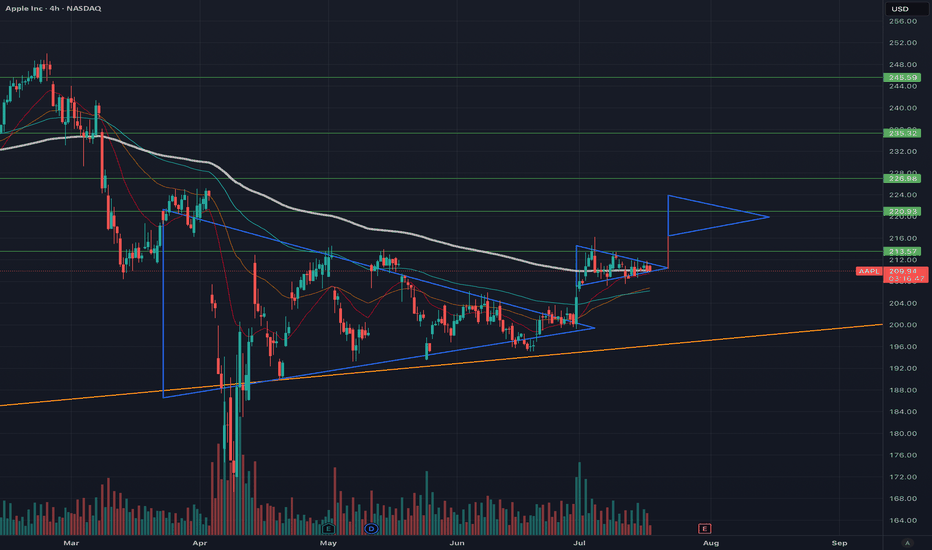
Apple has faced prolonged downward pressure from bearish investors. Despite its best efforts and some dips, the stock has steadily maintained a baseline price of 200 USD. The flag pattern required some adjustments along its path to break out, primarily due to geopolitical issues and economic variables. Ultimately, Apple broke out to the upside in the week of June...
Bitcoin has experienced an incredible surge, rising from $15,000 to over $111,000 in this bull cycle so far. I expect the market peak to be around $114,000 to $115,000, with historical trends indicating strong resistance at these levels. As a long-term Bitcoin bull who has navigated through multiple cycles, I see several indicators suggesting we might be nearing a...
Apple has faced prolonged downward pressure from bearish investors. Despite its best efforts and some dips, the stock has steadily maintained a baseline price of 200 USD. The flag pattern required some adjustments along its path to break out, primarily due to geopolitical issues and economic variables. Ultimately, Apple broke out to the upside in the week of June...
Apple has recently faced significant negative press, leading to fear and critical perceptions among investors. This situation highlights a common investment principle: buy in times of fear and sell in times of greed. As a result, I have taken a considerable long position on Apple, which I have since increased since my orginal post. The flag pattern on the stock...
Apple has been dealing with significant negative press recently, leading to fear and critical perceptions among investors. This situation suggests a common investment principle: in times of fear, you should buy, and in times of greed, you should sell. Consequently, I have taken a considerable long position on Apple. The flag pattern is almost complete, indicating...
Bitcoin has been trading horizontally since May 8th, with occasional breakouts both upward and downward. This trend is largely attributed to two factors: institutional buying and miners selling. The low trading volume on exchanges, combined with a decrease in daily trades from its recent peak in February 2024, has led to increased volatility, although these...
Despite Bitcoin (BTC) maintaining a price above $100,000 for several weeks now, it is clearly being supported by institutional buyers propelling the market. This is very bullish for the long term; however, BTC does need to correct in order to grow further. Volume continues to drop, and as soon as institutional buyers take a break, the price could crash. Given...
Apple has faced a significant amount of negative press recently, which has created a lot of fear and critical perceptions. This situation indicates that in times of fear, you should buy, and in times of greed, you should sell. As a result, I have taken a substantial long position on Apple. The flag pattern is nearly complete, suggesting that a move is imminent....
It looks like we might be seeing a double top formation, and with lower lows and reduced trading volumes, the positive momentum is running out. The yellow line at the top represents my sell line and is based on a long-term trend dating back to 2015. This line accurately predicted the recent all-time high (ATH) within $50. Although Bitcoin can break through this...
Apple has faced a significant amount of negative press recently, which has created a lot of fear and critical perceptions. This situation indicates that in times of fear, you should buy, and in times of greed, you should sell. As a result, I have taken a substantial long position on Apple. The flag pattern is nearly complete, suggesting that a move is imminent....
Fool me once... Fool me twice, shame on me. This looks like a good point of entry, but with the head and shoulders pattern completed as predicted, along with the following correction also anticipated, it is very likely that we are at the start of a bear market. FOMO (Fear of Missing Out) is clearly evident in the market as leveraged traders predict high numbers,...
Everyone always believes that a bull run has a long way to go—until it doesn't. Having experienced these cycles multiple times, I see similarities that help in understanding them. Could Bitcoin rise from here and hit $500k or more? Of course, but it could also crash to below $40k. The key question is: how much energy is there in the market to drive it up? When the...
The bull run has been ongoing since October 2023, and we are beginning to reach the final stages. This is the final push, likely a significant one, but there is strong long-term resistance and trends around the $115,000 mark. Altcoins are starting to gain momentum, but institutions are accumulating and absorbing new supplies, putting upward pressure on Bt prices....


