DiscoverFx
Monthly and Weekly price structure is bullish , Daily is currently bullish . Price reacted off the support zone as highlighted. Trade Safe! Good Health! Good Wealth!
Monthly and Weekly price structure is bearish, Daily is currently bearish . Price reacted off the support zone as highlighted. Trade Safe! Good Health! Good Wealth!
Monthly and Weekly price structure is bullish , Daily is currently bullish . Price reacted off the support zone as highlighted in the previous analysis please refer back to that for more information. Trade Safe! Good Health! Good Wealth!
Monthly and Weekly price structure is bearish , Daily is currently bearish . Price created a new resistance zone, retraces back into it and now is having a bearing reaction off the resistance zone as highlighted. Price could move lower from here. Please refer to the previous analysis for more information. Trade Safe! Good Health! Good Wealth!
Monthly and Weekly price structure is bullish , Daily is currently bullish. Price reacted off the support zone as highlighted in the previous analysis please refer back to that for more information. Trade Safe! Good Health! Good Wealth!
Monthly and Weekly price structure is bullish , Daily is currently bearish . Price reacted off the support zone as highlighted in the previous analysis please refer back to that for more information. Trade Safe! Good Health! Good Wealth!
Monthly and Weekly price structure is bearish, Daily is currently bearish. Price created a new resistance zone , there is a possibility to go for shorts to reach the targets mentioned once price retraces back into the resistance zone . Trade Safe! Good Health! Good Wealth!
Monthly and Weekly price structure is bullish , Daily is currently bullish . Price created a new support zone , there is a possibility to go for longs to reach the targets mentioned once price retraces back into the support zone . Trade Safe! Good Health! Good Wealth!
Monthly and Weekly price structure is bullish , Daily is currently bullish. Price created a new support zone, there is a possibility to go for longs to reach the targets mentioned once price retraces back into the support zone. Trade Safe! Good Health! Good Wealth!
Monthly and Weekly price structure is bullish , Daily is currently bullish. Price created a new support zone and currently is retracing back to it. There is a possibility to go for longs to reach the targets mentioned. Trade Safe! Good Health! Good Wealth!
Monthly and Weekly price structure is bullish , Daily is currently bearish . Price created a new support zone and currently is retracing back to it. There is a possibility to go for longs to reach the targets mentioned. Trade Safe! Good Health! Good Wealth!
Monthly is bullish, Weekly price structure is slightly bullish, Daily is slightly bearish . Once price retraces back to the resistance zone as highlighted and have a bearish reaction, price could go lower. Trade Safe! Good Health! Good Wealth! Risk: USD ADP Non-Farm Employment Change USD ISM Services PMI USD Crude Oil Inventories
Monthly and Weekly price structure is bullish , Daily is currently bullish . Once price retraces back to the support zone as highlighted and have a bullish reaction, price could go higher. Trade Safe! Good Health! Good Wealth! Risk: USD ADP Non-Farm Employment Change USD ISM Services PMI USD Crude Oil Inventories
Monthly and Weekly price structure is bullish , Daily is currently bearish . Price created a new resistance zone and currently is retracing back to it. There is a possibility to go for shorts to reach the targets mentioned. Trade Safe! Good Health! Good Wealth!
Monthly and Weekly price structure is bullish , Daily is currently bullish . Once price retraces back to the support zone as highlighted and have a bullish reaction, price could go higher. Please trade this pair with care. Could the short squeeze by the redditors on sliver be actually happening like it did on GME? Trade Safe! Good Health! Good Wealth!
Monthly and Weekly price structure is bearish, Daily is slightly bullish . Price retraces back to the support zone as highlighted on the Daily time-frame,H4 market structure turned bullish. There is a probability to look for longs to reach the weekly gap as highlighted. Trade Safe! Good Health! Good Wealth! Risk: FOMC
Monthly and Weekly price structure is bullish , Daily is currently bullish . Once price retraces back to the support zone as highlighted and have a bullish reaction, price could go higher. Please trade this pair with care. Could the short squeeze by the redditors on sliver be actually happening like it did on GME? Trade Safe! Good Health! Good Wealth!
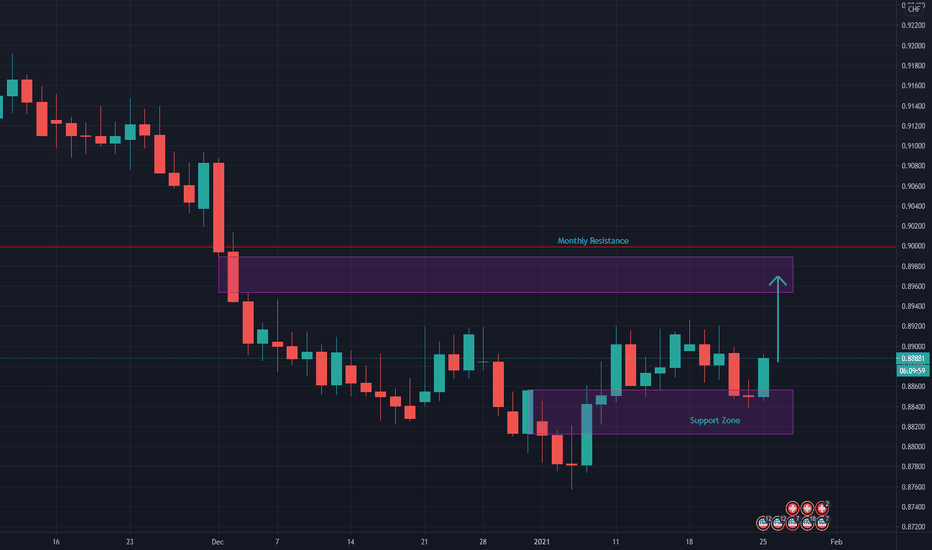
Monthly structure is bearish, Weekly structure is consolidating to weak bullish, Daily is currently bullish . Price currently retraces back to the Daily support zone as highlighted. Price could go higher from here and close into the weekly gap. Please trade this pair with care. Trade Safe! Good Health! Good Wealth! Risk: USD Advance GDP q/q


