Dmoootje
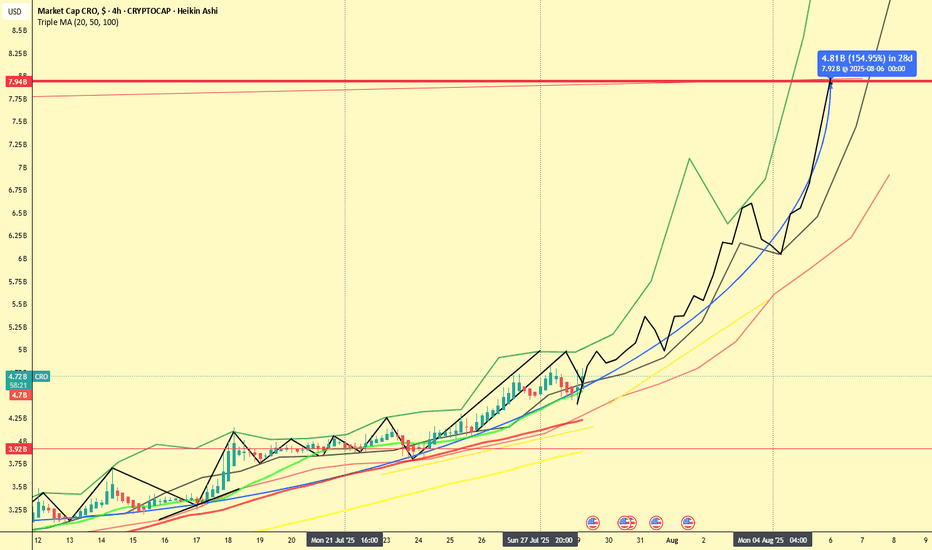
📆 July 29, 2025 📍 CRO Market Cap (4H Heikin Ashi - Historical Projection Analysis) If this chart doesn’t scream "Breakout Incoming", I don’t know what does. CRO (Crypto.com) is showing signs of a massive 154% move incoming — and it might all happen within 7 days, according to the current market cap projection. 🔍 Chart Breakdown The chart combines: Heikin Ashi...
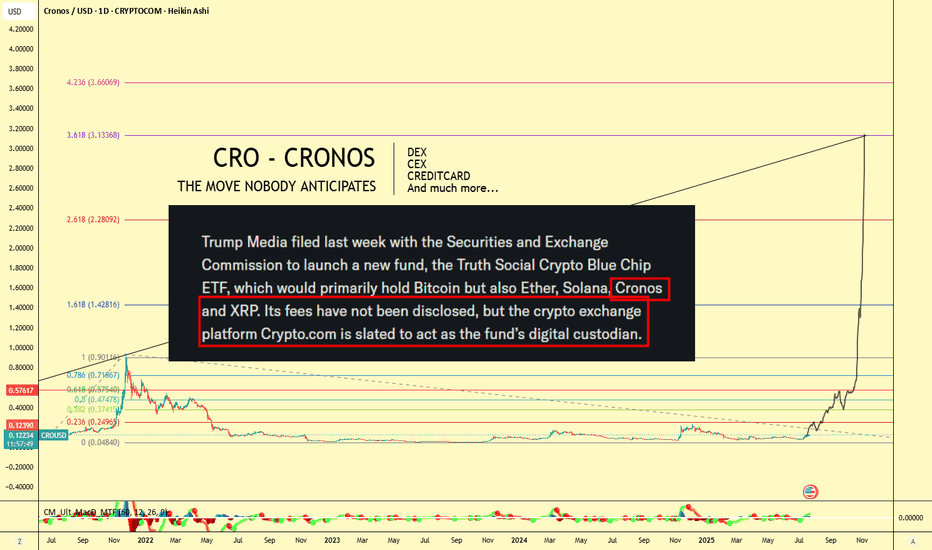
🪙 Ticker: OKX:CROUSDT 🕰 Chart: 1D (Heikin Ashi) 🔧 Tools Used: Fibonacci Extension, Fundamental News (ETF Filing) 🔍 Chart Analysis: Fibonacci Extension Targeting $3+ The Fibonacci Extension tool has been applied to the major CRO impulse wave from its peak near $0.90 (late 2021) to the 2022–2023 bottom at $0.0484, confirming a multi-year retracement and...
📉 AI Generated Bitcoin Prediction: No ATH This Week! 🚫📈 Euphorisme is what traps people... watch out. 📌 Overview In this 1H Heikin Ashi chart for BTC/USD, a clear AI-generated prediction outlines a volatile week ahead, but with no signs of a new all-time high (ATH). While price action recently broke above key resistance levels around $119,300–$119,570, the...
Chart displays the next cycle by combining the last cycle's path inside the fib extension tool. Going to keep it cool and ride the whole wave up. Good luck everyone If this plays out, I'll share the 2 other targets.
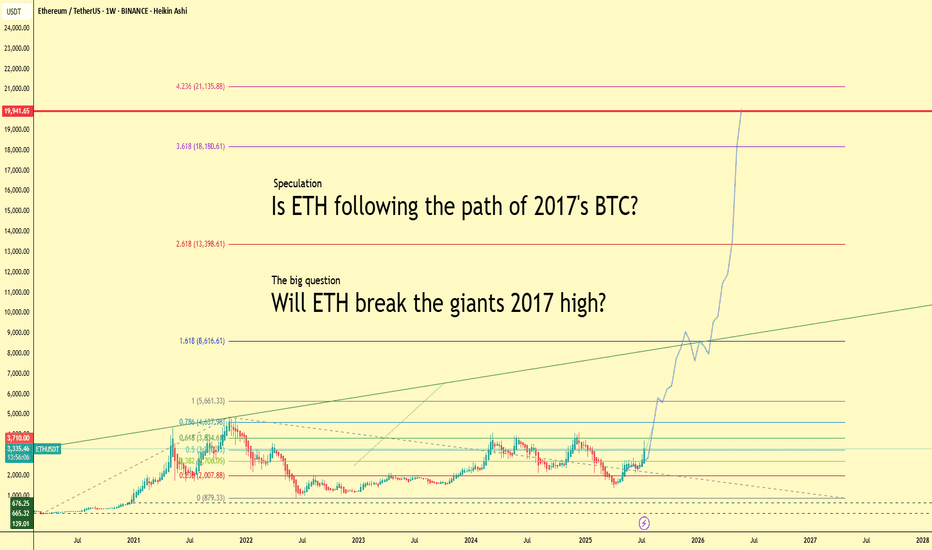
Ethereum is heating up — up more than 20% this week and currently trading above $3,300. But what if we told you this might just be the beginning? This chart explores a bold yet exciting speculation: 👉 Is ETH repeating Bitcoin’s legendary 2017 run? Back then, BTC went from obscurity to global headlines, smashing through $1k, then $5k, then $10k… and eventually...
🚀 Just sharing some insights to help you explore what XRP might be capable of. The chart you see here is a projection inspired by the path of XRP’s first major bull run. Surprisingly, I was able to map out around 95% of the key support and resistance levels using the Fibonacci extension tool. 📚 A little history lesson — while history doesn’t repeat itself...
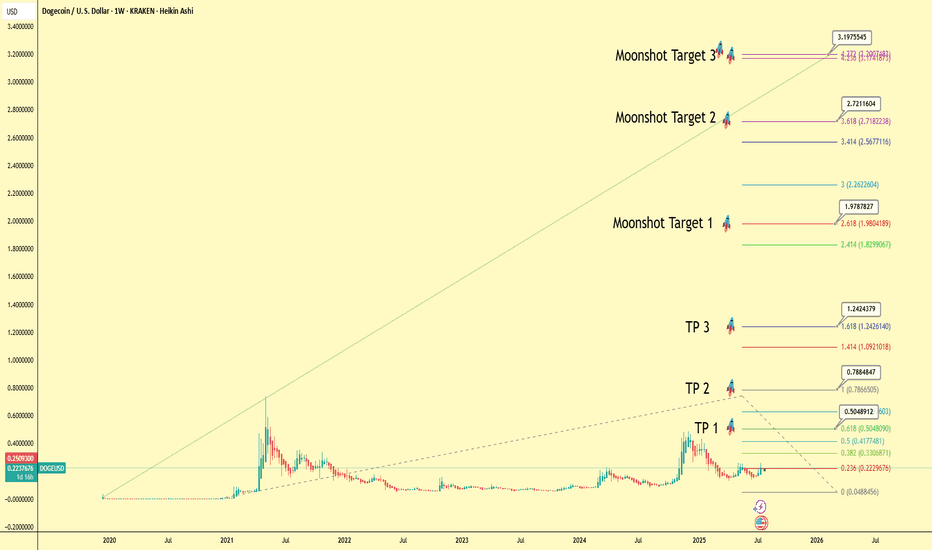
This analysis presents a long-term macro view for Dogecoin (DOGE/USD) using a daily Heikin Ashi chart to smooth out price action and better identify the underlying trend. The primary technical tool employed is a multi-year Fibonacci extension, a powerful instrument for projecting potential price targets in a trending market. Based on the key swing low and high of...
A confluence of technical signals on the weekly ETH/BTC chart, coupled with significant fundamental developments for both Ethereum and Bitcoin, suggests a potential upward move for the pairing in the coming weeks. Technical Analysis (TA) The weekly chart for ETH/BTC on Binance reveals a potential bottoming formation after a prolonged downtrend. The price has...
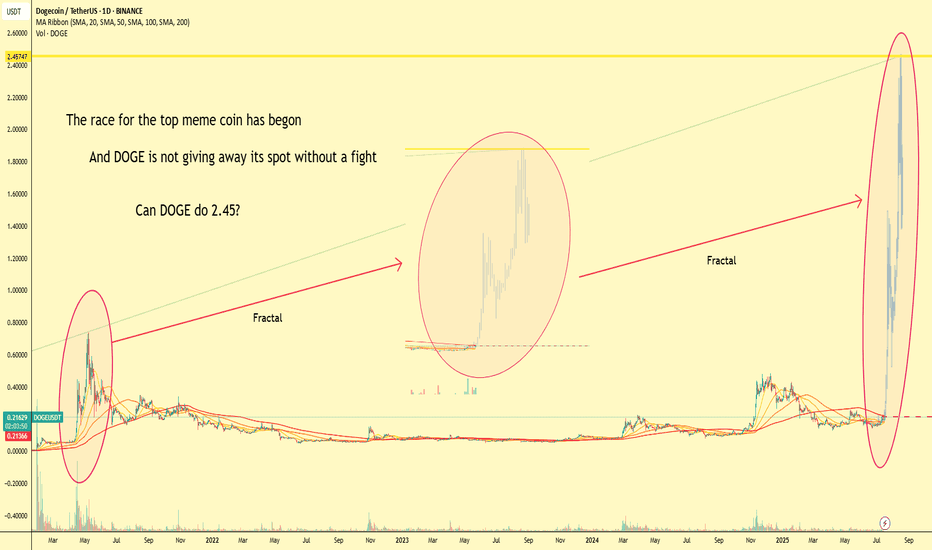
📈 The Meme Coin Race Has Begun 🔥 The battle for the throne is heating up... 🐶 DOGE, the original meme coin, isn’t giving up its crown without a fight. Fractals from the past seem to echo in today's chart – history doesn’t repeat, but it rhymes. ⚔️ With new challengers lining up in the meme arena, one question remains: Can DOGE reach $2.45 and reclaim the top...
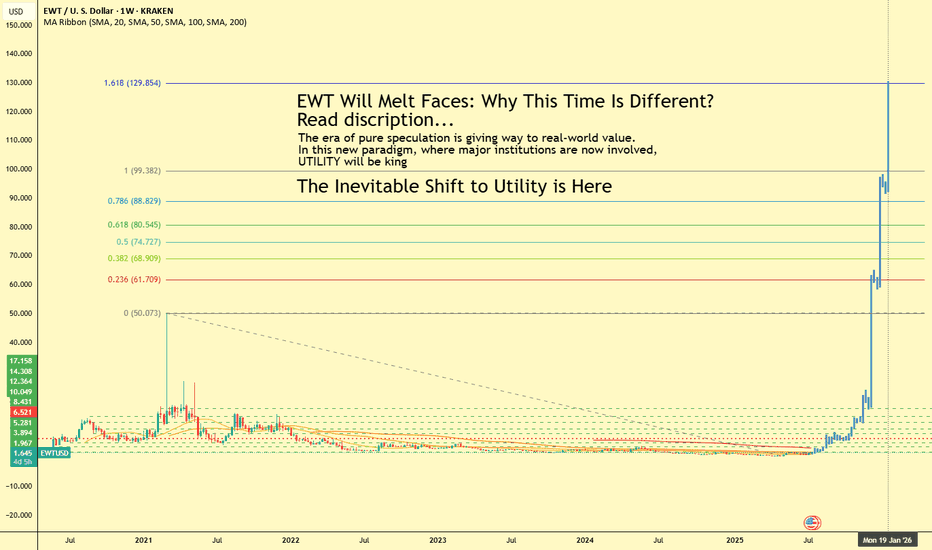
The crypto market is maturing. The era of pure speculation is giving way to real-world value. In this new paradigm, where major institutions are now involved, UTILITY will be king. One project is perfectly positioned to dominate this new age: Energy Web Token (EWT). As the world scrambles for sustainable energy solutions and the energy transition accelerates,...
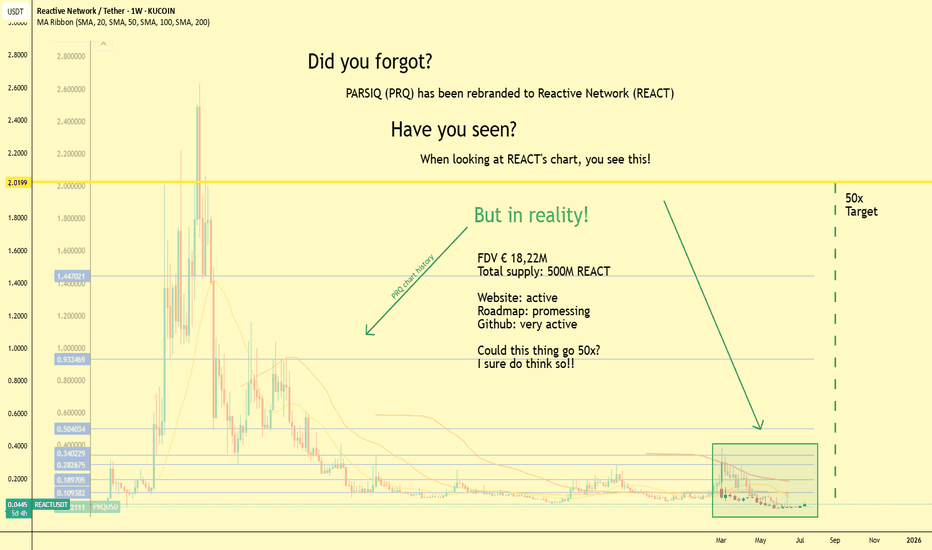
Is REACT Set for a 50x Price Explosion? Sometimes, to see the future, you have to look at the past. For those watching Reactive Network (REACT), a look back at the history of its predecessor, PARSIQ (PRQ), might reveal a path toward significant gains. After rebranding and a 1:1 token swap, REACT is poised to follow in PRQ's footsteps, with some analysts seeing a...
Connected some dots and we don't have to make it harder, the altcoin markets is picking up use cases and wit mature faster then we think, next FOMO will not only pull in corporate but the amount of people in crypto increases daily. I don't think anybody is ready for the next explosion.
🔍 Chart Highlights: Historical pellet price references: 2000: €200/ton 2014: €273/ton 2016: €217/ton Recent upward trend since COVID-19 dip, known as the “Coronadip”, reflects increasing demand and market correction. Forecasted pellet price levels based on raw material trends: Minimum projection: €291/ton Expected projection: €328/ton Maximum projection:...
Just another " bottom is in " signal. Cross your fingers that history is a mighty indicator. This is no advice, prices always could go lower depending on the current world conditions.
Just created it for myself but can't keep this away for some of you. Simply illustrated some times it took for Bitcoin every halving cycle to reach the bottom, top and the total bottoming time. Enjoy
Is ICX repeating previous pump? Historical indications are no guarantee, but when comparing the setup at the moment it looks nice. This kind of chart pattern is what could be in store for ICX in the short term. This is just an idea, do not see this as advice. If you do want in here, be sure to set an SL right under the bottom line of the rising wedge. Grtz
Simple chart on this new promising project called MATE Why I'm posting this? Bottom looks to be in. Nice volume candle on the daily. Recently added roadmap and as I know by now, MATE devs always deliver. This is a mid to long term hold and could be very profitable, it's a must-have at this price for every portfolio. SOME FACTS What is MATE? Mate...
Hello everyone, Today I'm covering Algorand (ALGO), both BTC and USDT pairings compared, chart maybe unclear for some but let me explain what it tells me. VS BTC I see a mid-long term uptrend forming, MACD and MA's on the ALGO/BTC chart tell me it's time for Algorand to start flourishing. Versus Bitcoin, Algorand got left behind in the run but is now testing new...
