Bitcoin has broken through the 200 MA which is amazing for the BTC bulls but I would pay close attention to the tweezer top candle formation we are seeing here on the daily and also the type of ascent we have seen on the lower time frames. This is showing me that we could be seeing a false breakout/bull trap. Plus if we look at the lower time frames we can see...
Hi guys, If you have a look at the price action on the lower time frames as well Its not a completely convincing BTC breakout. Also looking at the RSI on the 1hr it's looking like it's favouring some bearish movement more than a continuation higher. Nevertheless, as we know a break above this 200 MA would be extremely beneficial to bitcoins progress higher...
Hi guys, just an update on my previous post. We are seeing an extremely corrective decent here, we know this isn't sustainable and a reversal is the likely scenario. Whether we make it down to the 37.7k and reverse or all the way down to the 37k level before a reversal is still up in the air.
Hi guys, been on holiday so no posts for awhile. Looking at the charts we can see the price did in fact break the high at 41.3k and continued with a corrective squeeze higher to around 42.75k before a swift rejection at this level sending the price back down to the 40k levels resulting in a 6% loss in the BTC price. For me right now I think we could see the...
Hi guys, No posts for awhile due to how range bound the price has become between 36.6k and 30k and just the corrective nature we have been seeing as a whole. I still think BTC is going lower but we will likely to get a pull back of +5/+8% around this area similar to what we saw early July, followed by a a dump soon after allowing the bears to target the 30k zone...
Looks like yesterday's push was a false breakout in the end. I mentioned in my previous post how important it was that we found support around the 35k zone to continue this push but unfortunately, the bears managed to pull the price back below this level. We have now not only seen a break back into this large descending structure but we have also broken below...
Hi guys, Nothing that crazy happening as of yet but the bias is shifting slightly to the bullish side now. As we have now broken out of this large descending structure and are approaching the 36.k resistance I thought I would give a quick update of my thoughts. If the bulls can now find some support from the 35k zone that would be the best-case scenario for BTC...
Morning guys, just a quick update on my analysis yesterday. We saw the breakout to the downside last night/early this morning as I said was likely to happen yesterday. We can also see some very very strong bearish divergence on the RSI as well. I think we can quite comfortably and realistically predict a drop-down to around the 30k levels again now potentially...
(Most likely medium-term scenario) I think if we see a bearish breakout of this ascending channel we have been in since Jun 26, we would likely see an aggressive shakeout giving the bears the legs needed to target the 30k levels and below relatively soon after the break. However, like I mentioned yesterday a solid breakout above the 20 EMA/high at 35.5k and a...
Soooo, guys how we doing? Looks like instead of dropping out yesterday bitcoin has decided to come back up to test the 20 EMA after all like my analysis a few days ago was anticipating. Since the 11:00pm pump we saw last night we haven't really moved much today, BTC has just consolidated around the 20 EMA line showing that the bulls have found some serious...
Hi guys, Sorry for not posting yesterday. We again saw that classic bullish divergence via the relative strength index again, I've marked it with arrows. This again results in a break higher starting around 23:00pm last night topping out around 35.5k at 9:00am this morning UK time. I feel like the price is potentially going to break out the high at 35.5k but...
Following up from this morning analysis BTC has now broken the 32k level giving the bears the new target of 30k/28.8k to hit over the weekend. It looks like a re-test of the 20 EMA isn't going to happen now as the bearish pressure was stronger than I thought, this is all good though as the quicker BTC hits the 23k/20k zone the quicker we can end this bear...
1. We can see here via the RSI some bearish divergence on the daily, and as you know the higher the time frame the more weight the confluence holds. 2. We have gold forming this massive H&S style reversal structure. 3. Gold has also been in this large descending channel since Aug 2020. We saw a breakout attempt on the 20th of May 2021 at the third touch of the...
Just a quick update on my previous post guys. I still think the probable scenario is for bitcoin to push up and test the 20 EMA around 36k USD but it seems to be taking a little longer than I originally anticipated due to some indecision in the markets. You can see how nervous retail traders are right now, look how much the trading volume has been decreasing...
Bitcoin definitely has some work to put in before we can comfortably and realistically say we are back in a bull market. A rejection on/around the 20 EMA area (Blue line) is the most likely scenario in my eyes + we have bitcoin forming the mother of all H&S right now so there is a possibility that could play out to the downside, If that happens we could be in for...
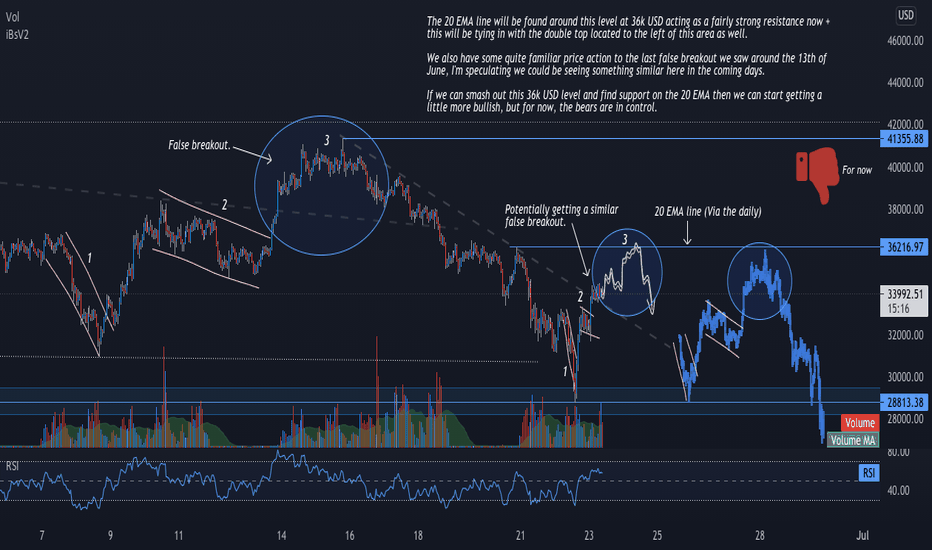
The 20 EMA line will be found around this level at 36k USD acting as a fairly strong resistance now + this will be tying in with the double top located to the left of this area as well. We also have some quite familiar price action to the last false breakout we saw around the 13th of June, I'm speculating we could be seeing something similar here in the coming...
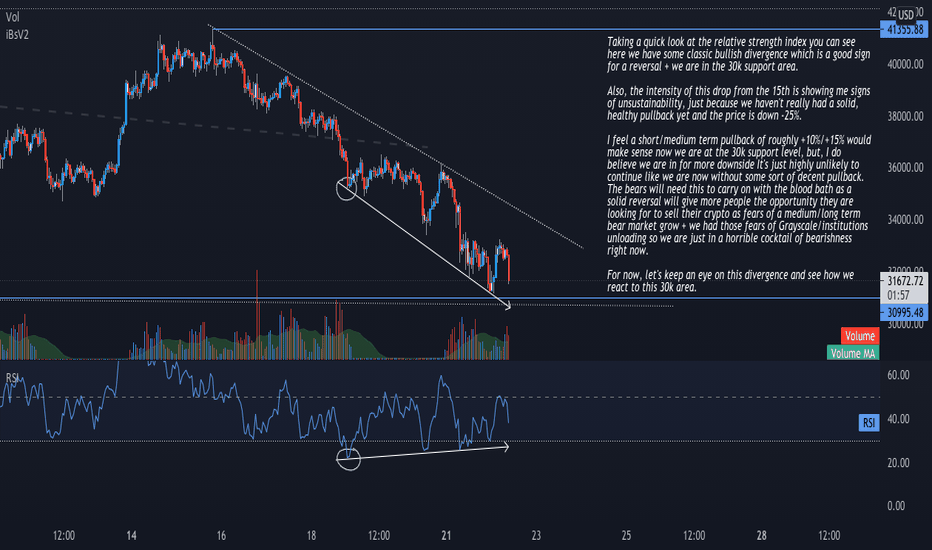
(Sorry for no posts the last few days, I was waiting for BTC to make the 30k zone as we were just in no man's land) Taking a quick look at the relative strength index you can see here we have some classic bullish divergence which is a good sign for a reversal + we are in the 30k support area. Also, the intensity of this drop from the 15th is showing me signs...


