ERge10
In monthly candles we can see a cup and handle pattern.
Après avoir brisé en décembre 2019 une résistance de plus d'un an, SFR semble être parti pour une hausse en 2020. Nous venons d'assister à une sortie par le haut d'un drapeau (ou d'une résistance à 129). Objectif de court terme à 135.
Avec une faible volatilité depuis fin novembre, si IDI franchis la résistance entre 45 et 46€, une continuation de tendance se dessinerait alors.
1) Low volatility 2) Bullish triangle 3) Continued uptrend
1) Low volatility since October, 2) This stock returned in an uptrend, 3) A breakout of 0.88 $ would indicate a strong continuation of trend.
Correction seems to be over for the Argentinian index. Beginning of the next bull run.
I hope BTC will exit the descending triangle.
i will buy after the breakout from the descending triangle
If the curve comes out of the triangle on the upper side, the next Fibonacci level is $11500. 11500 is a strong resistance level that acted as a double-top the 20th Feb and 5th May.
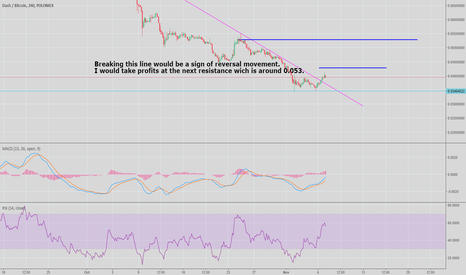
Going through the yellow line will sign the end of downtrend movement.
if the LTC curve comes out of the triangle from above and volume appears, then we have a sign of purchase. BTC price may have an impact.
divergence MACD and RSI. Need to break the resistance to come back to all-time high.


