Similar to my recent SGMO idea, my view is that aVWAP support, 50% retracement and 50 day EMA support make a strong case that a relative low is in and higher prices are soon to come. For ALPN, the aVWAP cluster from recent significant lows/highs all cluster in a tight range in the mid 11s, which is right where the stock reversed. Likewise, if the stock goes below...
$SGMO has been correcting its 100% surge higher, I believe I have found enough evidence to suggest the $SGMO pullback has completed and represents a great buy opportunity: 1) +1 year long resistance is acting as support 2) reclaiming of the aVWAP from the bottom for the first time in 8 days 3) holding the 50 day EMA 4) consolidation occurring at the 50%...
The blue highlighted area of $AESE is what first caught my eye. Compared to $ETHE, which has had a massive move recently, I believe $AESE is showing the same blue area and strict uptrend following a several month rounding bottom. If the pattern is valid, I think the black trendline needs to remain as support. If it fails to do so I would have to reject my...
Oil sector is looking very bullish to me, these are just a few that caught my eye
$OSTK has broken out of a falling wedge and has found support at aVWAP from Aug 2020 peak. The test of the aVWAP from above created a long green hammer candle which included a 6% intraday rally. From the current closing price, a stop loss below that long wick candle (whether you use a hard stop or mental stop) would be risking about 6-7%. Seeing how OSTK tends...
***Linked below: I drew $STMH as a wedge breakout back on 1/26/21 ***Linked below: a repeating breakout pattern I've noticed recently in some big movers Revisiting the $STMH chart, I believe how I've drawn it here is a much better way to visualize it. I noticed this ascending triangle/multiple 'loop' pattern breakout in some high flyers, and what $STMH is doing...
Top: right shoulder of an Inverse Head and Shoulder pattern forming for the least year. The right shoulder is taking the form of the wedge, consistently respecting the rising lower trendline (to the tick), and roughly respecting the larger parallel channel midline, which acted as important support in the left shoulder prior to the breakdown. Bottom: all of the...
$TESS has broken above $7 and established support after failing to do so for over a year. The stock appears to have resumed the breakout today with increased volume of 108K shares, which is >2x the next highest volume day in the last 10 days of 42K. The failed breakout in August 2020 had TESS closing above $7.00 only 5 consecutive days, this time, the stock has...
$KBNT has found support numerous times at the 50 day EMA and the aVWAP from the IPO, the stock also filled the gap from the December drop and is approaching apex of a triangle/pennant formation which I expect to breakout to the upside. I also like that $KBNT is just a $70 mil mkt cap in the digital advertising space. The sector has a history of producing...
I know $GME is sucking all the air out of the room, but $STMH is just a $44 mil mkt cap California based weed stock, they've made an acquisition to focus on delivery. The past 2 weeks of trading have had the highest volume days in the stock EVER, just as it's breaking out of a wedge from all time lows. I have a feeling this is going to be a big reversal and I...
Besides what I view as very similar price action, PESI found support over the last few weeks right at the $5.80 level. Looking back 6 years, the $5.8-5.6 area was tested 3x as resistance and has just been turned to support. -A close below the rising trendline support around $5.85 would violate my thesis for $PESI following the $MU path. -$MU gained 60% from the...
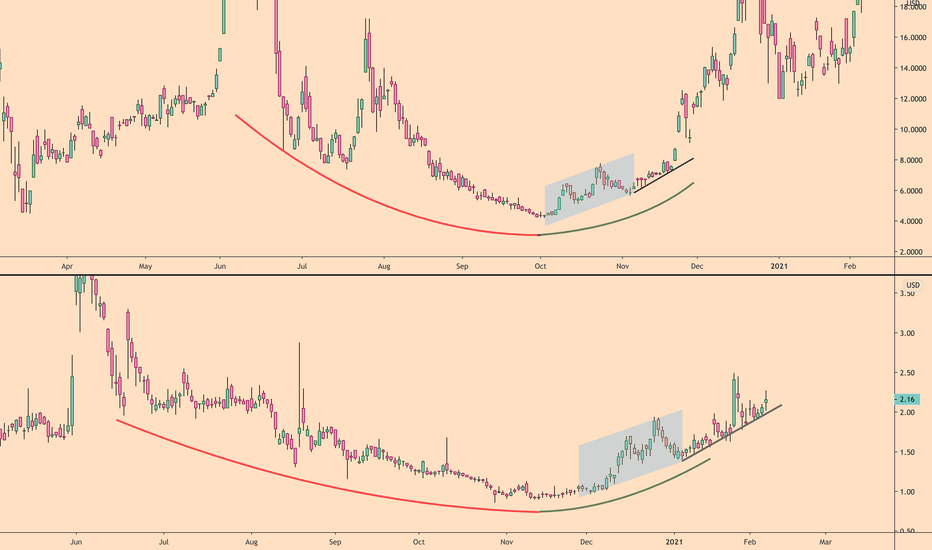
Last Tuesday (idea linked at bottom) I thought $OPTT was following the $POLA path to a breakout. OPTT ended up nearly doubling and I think there is more to go. I wanted to provide a more comprehensive look at the pattern I have seen play out multiple times. My next idea will be 4 stocks that I believe are making this pattern that have yet to breakout. The...
Top: $DRNA weekly candle chart upon today's close (1/20/21), with anchored VWAPs (aVWAPs) on each top/bottom within the triangle consolidation, as the aVWAPs have tightened, the stock has begun to respect their price range as support. Bottom: $FLGT daily chart as of 12/3/20, at that point in time FLGT also began to respect the price level of the tightening aVWAP...
Top: $POLA as of 1/4/21, the stock has nearly tripled since then Bottom: $OPTT as of today 1/19/20 I can't be the only one who sees a striking resemblance ***I am long OPTT
$GNK has turned the $8 level into support after failing to break above it 4 times since August 2020. If you can buy the stock at the current price, you can put a stop at $7.8 which would put your stop below that long wick on 1/13/21 and keep your downside risk at 5% of your cost basis, seems like a pretty good deal to me.
Hard to believe a semiconductor stock in this market is just breaking out of a 7 year base. I feel pretty comfortable betting on more upside to come.


