Entry AUDCAD - 12/05/25 time 11.38 Asian highs taken out aiming for Asian lows 3pin on right shoulder fib 78.6 exactly US Dollar Index posts over 1% gain after China and US announce a 90-day tariff truce. Fed’s Kugler says assessing economy remains difficult amid trade shifts and household stockpiling. US 10-year Treasury yield spikes to 4.45%, supporting...
Loving this set up great run.resident Donald Trump says tariffs on Chinese imports to the United States will eventually be lowered, after both Beijing and Washington appeared to soften their positions about potential trade talks. “At some point, I’m going to lower them because otherwise you could never do business with them,” he said in an interview with NBC’s...
Nonfarm Payrolls (NFP) in the US rose by 177,000 in April, the US Bureau of Labor Statistics (BLS) reported on Friday. This reading followed the 185,000 increase (revised from 228,000) reported in March and came in better than analysts' estimate of 130,000.
I look for 3pin head and shoulders on a chart, Optimism about a de-escalation in the global trade conflict helped the US Dollar (USD) despite disappointing data releases. US President Donald Trump reported undergoing trade talks with South Korea, Japan and India. He also claimed that there’s a “very good” chance of clinching a deal with China, yet added that any...
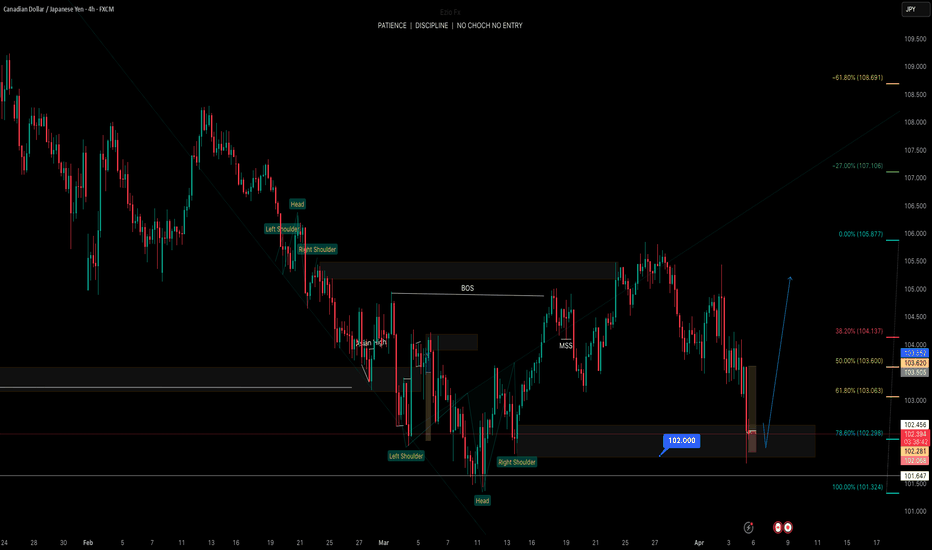
An increasing probability of stagflation risk in the US may see further narrowing of the 2-year sovereign yield premium spread between US Treasuries and JGBs. CAD/JPY is the second worst-performing major yen crosses in the past three months. CAD/JPY may see another round of impulsive down move sequence with the following medium-term supports coming in at 99.60 and 97.55.
AUDUSD - ENTRY 03/04/2025 INVERSE HEAD AND SHOULDERS FIB 78.6 CLEAN BULLISH WICK 3PIN AUD/USD trades in negative territory near 0.6280 in Thursday’s early Asian session. China will face a 54% tariff under the new Trump policy, weighing on the Aussie. China’s Caixin Services PMI climbed to 51.9 in March, stronger than expected. The AUD/USD pair remains...
Another pair that appears attractive for buying at a key Bullish flag.A bull flag is a chart pattern used by technical traders to signal when the market is likely to rally further. This pattern usually appears when prices undergo a short-term corrective phase within a broader uptrend, indicating that the asset is likely to experience a further rise in price. The...
CHF JPY Entry 1pm 26/03/2025 Bull flag with pole fib 78.6 CHFJPY currency pair recently broke the resistance zone lying at the intersection of the resistance level 169.50 (former upward correction top from February) and the 38.2% Fibonacci correction of the sharp downward impulse from December.
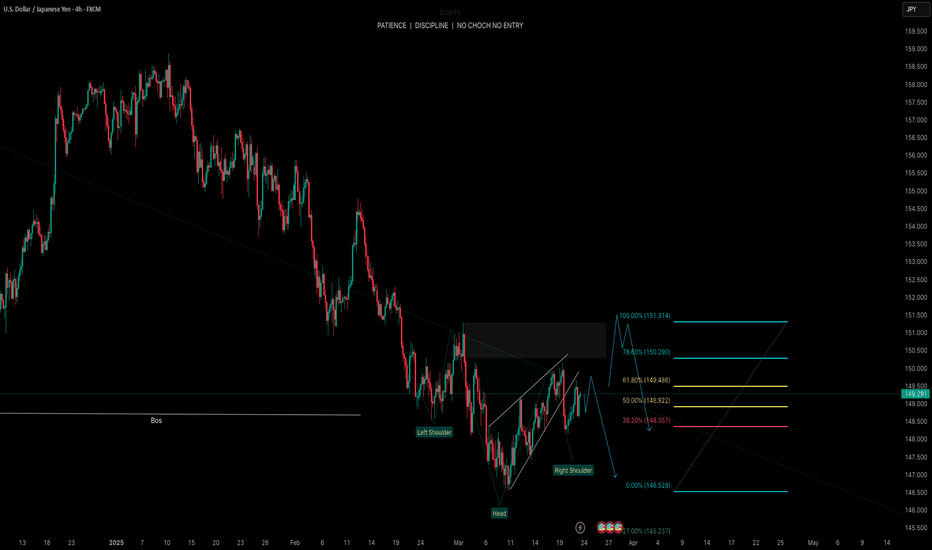
USD/JPY falls back as the US Dollar gains on the Fed’s support for a restrictive policy stance. US President Trump’s tariff policies are expected to boost US inflation and weigh on economic growth. Japan’s National CPI cooled down in February. The USD/JPY pair gives up entire intraday gains after facing selling pressure around 149.60 and drops to near 148.60...
AUD/USD trades near the 0.6270 region, failing to recover ground amid persistent USD strength. A soft Australian labor market report and safe-haven demand for the US Dollar continue to weigh on the Aussie. Technical indicators point to further downside as the pair remains below key moving averages. The AUD/USD pair remained depressed during the American session...
USD/CHF trades sideways around 0.8820 even though the US Dollar trades strongly. Fed Williams believes that the current moderate restrictive policy stance is appropriate. The SNB cut its interest rates by 25 bps to 0.25% on Thursday. The USD/CHF pair flattens around 0.8820 during North American trading hours on Friday. The Swiss Franc pair trades sideways even...
We’re set to receive the latest round of global Purchasing Managers’ Indices on Monday, and it’s the European data that will likely be in the spotlight, putting the EUR/USD forecast in spotlight. The question is whether Trump’s trade war is already starting to dent business activity worldwide. In the Eurozone, manufacturing PMIs have been inching higher, but they...
We have a great bearish flag breaking out great trend.USD can return back to the low/mid-1.42s "BoC Governor Macklem’s remarks on tariffs and monetary policy yesterday underscored the Bank’s sensitivity to the inflationary consequences of trade wars. He noted that the hot February CPI report had got policymakers’ attention but their outlook had not fundamentally...
USDCAD _ ENTRY Inverse head and shoulders 78.6 fib - THE best fibs 9am uk candle after news doji candlestick USD/CAD climbs to near 1.4370 as the US Dollar strengthens in the aftermath of the Fed’s monetary policy. The Fed left interest rates steady and maintained its forecast of two interest rate cuts this year. Analysts at BofA expect the BoC to cut...
USD/CAD faced strong resistance near 1.4800 last month and has recently carved out a lower high at 1.4550, Société Générale's FX analysts note. Below 1.4240, USD/CAD can fall towards 1.4150 and 1.4030 "Daily MACD is within positive territory but has dipped below its trigger line highlighting receding upward momentum. A short-term pullback is taking shape. Low...
We have a great set up where a bull flag is broken.he gauges were set to open mixed after a sell-off that saw the S&P 500 (^GSPC) enter correction territory and the Dow book its worst weekly performance since March 2023. Markets have been buffeted by economic slowdown fears and uncertainty over Trump's unpredictable tariff policy.
Nasdaq index in correction territory, many investors are trying to decide if it's a buying opportunity or if they should run for the hills. A correction is marked by an index declining 10% from its all-time high, which isn't quite as severe as a bear market. Additionally, stocks aren't necessarily a blanket buy or sell right now. Instead, I think there are certain...
EUR JPY Entry head and shoulders fib 78.6 right shoulder rejection 3pin EUR/JPY strengthens as the JPY weakens amid shifting safe-haven flows and an improvement in global risk sentiment. Japan’s top companies are poised to implement substantial wage hikes for the third straight year to help workers cope with inflation. The Euro gains as the Franziska...


