ACAD starting forming a Triangle from its all-time high $51.99 way back in Jul 2015. Prices have been consolidating for almost 2 full years which is almost identical to that of CELG. CELG and biotech sector has been rallying lately as a whole. ACAD could be the next in line. A successful confirmation of its triangle will imply an upside target of its all time high...
ALK has broken out of its Minuette Wave (iv) in good momentum after finding supporting at its 50% fib retracement. Look for a minute upside target of $101.43 with SL at low of Minuette Wave (iv) at $82.03. Break of this low will invalidate this analysis.
CELG has been retracing from its recent highs at $127. The correction should be near completion. If not, it would not be too far off. Target $150 or more with a strong break above its recent highs of $127 with a SL at its correction lows.
ESPR appears to have completed a textbook ABC correction. Look out for a upside target of recent highs of $48.21 and more. SL: Recent lows at $30.95
BITA has fallen 84% from its 2014 highs of $98.28 to its 2016 of $16.09 low. Stock has shown signs of recovery from its 2016 lows. Impulsive upward momentum could imply further pending upside. Key support at $25.75 Critical support: $16.56 Upside Target: $45-$55 Break of critical support will void this analysis.
With Oil likely to be topping soon, O&G exploration is one industry to look out for potential trades. CLR: Since its low in 2016, CLR has completed a 3 wave set back and topping around the 60 zone. Prices are likely to be in the early stages of the reversal and in a 1-2, 1-2 wave sequence. Fibonacci: Prices has reversed around the 61.8% retracement Momentum: RSI...
BIIV has broken into new high grounds on an intra day trading. Look for a strong daily close and breaking of the upper channel line. A successful upside break target of between $75-80 or more. SL: Recent lows at $51.05
USDJPY appears to have completed a near textbook A-B-C consolidation. Both trend and momentum are showing divergence which supports the analysis. Entry at current price with SL at recent lows ($109.114) provides a great Risk-Reward ratio. For a confirmation of uptrend resumption, you may like to wait for a strong break of the trend channel. SL remains the same...
Disappointing earnings guidance from CUDA 1.83% during its last earnings reports resulting in a 16% downside gap. It has resulted in an extended consolidation in the form of W-X-Y. Prices are in the midst of completing Wave Y. A break of critical support at 9.44 (Dotted Red Line) will invalidate this analysis. (Previous Analysis)
BOX has completed a 5 wave leading diagonal and is currently consolidating its gains. The completion of a 3 waves consolidation will bring it to high 20s onward. At present, Minuette Wave b appears to be completed. It could still extend further to create a more complicated wave pattern. Once completed, it will bring prices down below Minuette Wave a to complete...
JAZZ has completed a textbook A-B-C correction bottoming out at 95.80 in Nov 2016. Sharp reversal at 50% fib retracement is good sign. 2W RSI and MACD divergence is a significant supporting evidence of the upturn. Look for an initial target of its previous high of 194. Critical support at Minuette Wave C at 95.80. Break of this low will invalidate the trade.
BMWYY has complete an Expanded Flat in Jul 2016 at 23.65. Look for a minimum target at its previous high at 44 zone. A break below 23.65 implies a more complex and extended consolidation.
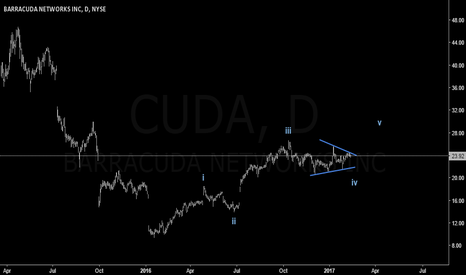
CUDA appears to be forming a triangle to complete Wave iv. Wave D might have been completed. if not, it will not take very long to do so. Once Wave E is completed, look to go long on a strong break of B-D trendline with a SL under Wave E. A break down below Wave C implies a more complex pattern which invalidates this triangle setup. (Detailed H4 Chart)
ABBV has been consolidating in the triangle range since its high in Jul 2015. RSI has found support at bull market support at 50-60 zone and is turning up. A successful and strong break of (b)-(d) trendline and preferably high of Wave (b) will imply the completion of the consolidation and start of a new uptrend to new highs. A break of Wave (a) low will...
SIMO has retraced a significant amount of its Wave (iii) upside from its all time high $56.21 in Jul 2016. Fibonacci: It appears to have bottomed up and rebounded from its 61.8% retracement. Indicators: Momentum divergence of RSI and MACD is supportive of the analysis. Look for a conclusive break above the Ending Diagonal for a high confidence trade. If the...
BOX is a rather new listing which is less than 2 years old. A upcoming Cloud service provider which primarily serves corporate clients to manage their content and collaborate internally/externally on the cloud. Though it is down 27% from its list price, recent price action is however showing signs of strength. From an Elliotician perspective, it is displaying...
CELG broke out of its multi-month triangle consolidation on 08 Nov 2016 triggered by the election results. The election of Trump was deemed to be a boost to Biotech as compared to a Clinton administration. However, Trump came back firing at biotech stocks resulting in knee jerk reactions. CELG has since been in consolidation mode. In my view, the consolidation...
AUDJPY: Look for more upside once correction is completed. Trade will invalidate upon break of Subminuette Wave iv. (Detailed H1 Chart)


